There are two main types of graphs:
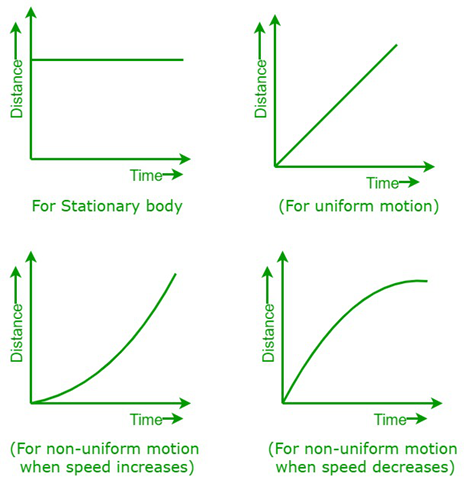
- A displacement-time graph (D-T) represents the relationship between an object’s position and the time. Displacement is on the y-axis, and time on the x-axis.
Gradient: Velocity
Steepness: The steeper the graph, the faster the velocity (which is constant) is.
Curve: Change in velocity
Horizontal: Stationary
- Uniform motion: when an object moves with a constant velocity, in a DT graph this movement appears as a straight line with a constant slope.
- If the object is stationary the line will be straight across the x-axis not moving up or down the y-axis.
- When an object’s velocity changes, the graph will have a curved line. If the line is going upwards then the object is accelerating, if it is flattening, it is decelerating.
- If the object’s velocity becomes negative (aka it is going backwards) then the graph would go downwards the y-axis, but never backwards.

The second type of graph is a Velocity Time Graph (V-T)
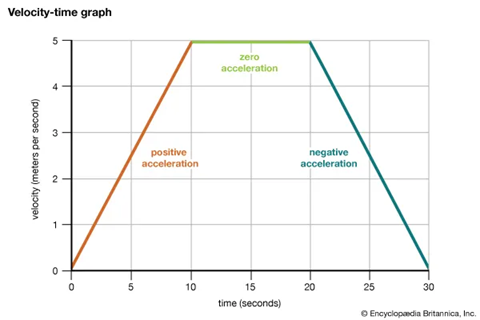
A v-t graphs is a representation that shows the relationship between the object’s velocity and the time passed. The velocity is represented on the y-axis, while the time on the x-axis.
Gradient: Acceleration. (Calculated by V/T)
Increase in Speed: Also meant as positive acceleration, it is manifested by the Y-axis increasing.
Decrease in Speed: The opposite, so negative acceleration and is manifested by the Y-axis decreasing.
Flatline: Happens when the gradient is equal to 0, so when no acceleration is occurring.
- Constant velocity: If an object moves with a constant velocity, the velocity-time graph will appear as a horizontal line parallel to the time axis. The height of the line represents the magnitude of the constant velocity.
- Uniform acceleration: If an object undergoes uniform acceleration, the velocity-time graph will be a straight line with a constant slope. The slope of the line represents the rate of change of velocity, which is the acceleration. The steeper the slope, the greater the acceleration.
- Changing velocity: When an object's velocity changes, the velocity-time graph will have a curved shape. The slope of the graph at any given point represents the object's acceleration at that time. Positive slopes indicate positive acceleration (speeding up), while negative slopes indicate negative acceleration or deceleration (slowing down).
- Instantaneous velocity: The value of the velocity at any specific time can be determined by reading the corresponding point on the graph. The vertical position of the point represents the instantaneous velocity of the object at that time.

Editors- Editor Amato - 408 words.
View count: 2893