
Ocean Currents
The density of seawater
Temperature: (Rise in Temp = less dense)
Pressure: (Rise in pressure = denser)
Salinity: (Rise in salt content = denser)
Gyres: Dominant pattern of surface ocean currents
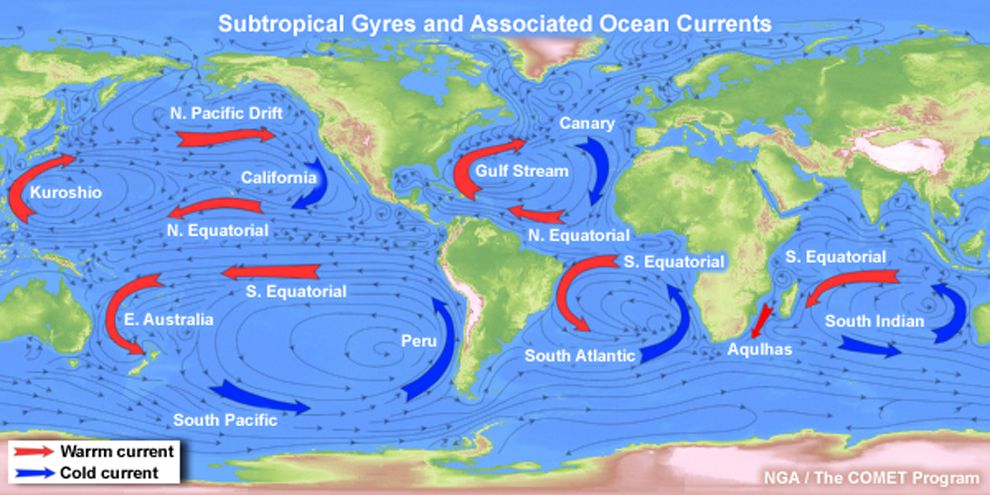
Northern Hemisphere = Clockwise
Southern Hemisphere = Anti-Clockwise
Antarctica = W → E
Influence of Earth's rotation
- Causes water push westwards (piles water on the west edge)
- Return flow = Narrow / fast current eg. Gulf Stream
Warm and Cold Currents
Warm currents make water move away from the equator
Cold currents more water away from cold regions and towards the equator
- Warm currents from equator raise the temp in polar areas
- Cold currents reduce summer temp
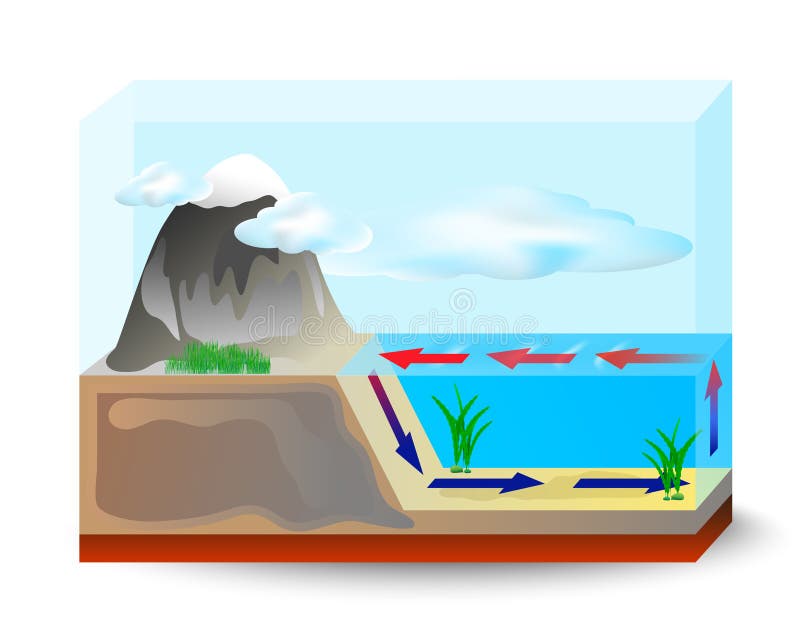
- Eastern oceans experience upwelling
- Ocean currents move nutrient-rich cold water from the ocean floor to surface
- Supports fisheries
The Ocean Coveyerbelt
Warning: debatable topic with little to no consensus
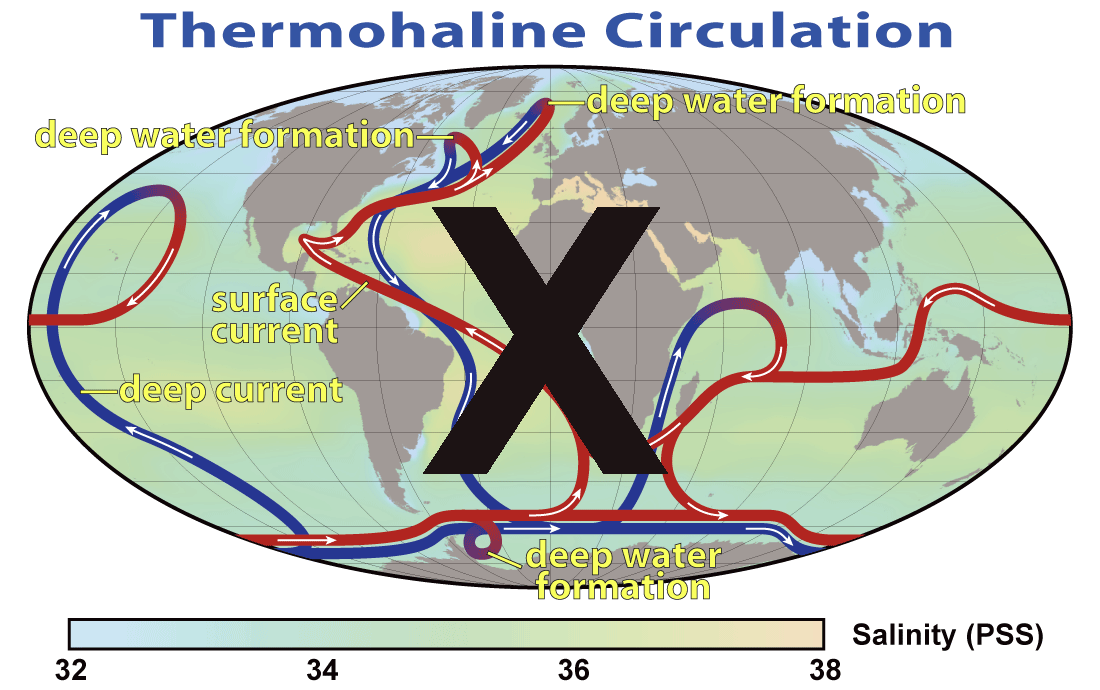
- Transfer of energy by deep-sea currents
- Oceanic convection from the polar regions (cold water sinks and spreads to deep basins)
Tidal Currents

- The Periodic fall and rise of the ocean
- Produced by the attraction of the moon
- Occurs every ~12hrs
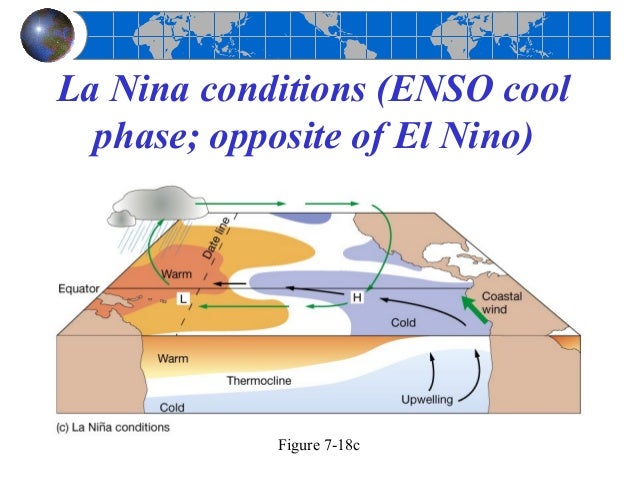
El Niño & La Niña
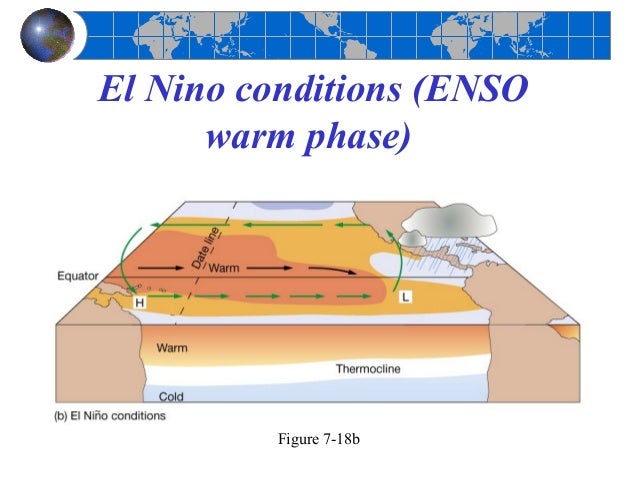
- El Niño (Spanish for the child in reference to baby Jesus) = Warm surface currents in equatorial eastern pacific that occurs periodically around Christmas time
- Southern Oscillation = change in the atmospheric pressure over the Pacific Ocean accompanying El Niño
- ENSO describes a combined oceanic atmosphere disturbance

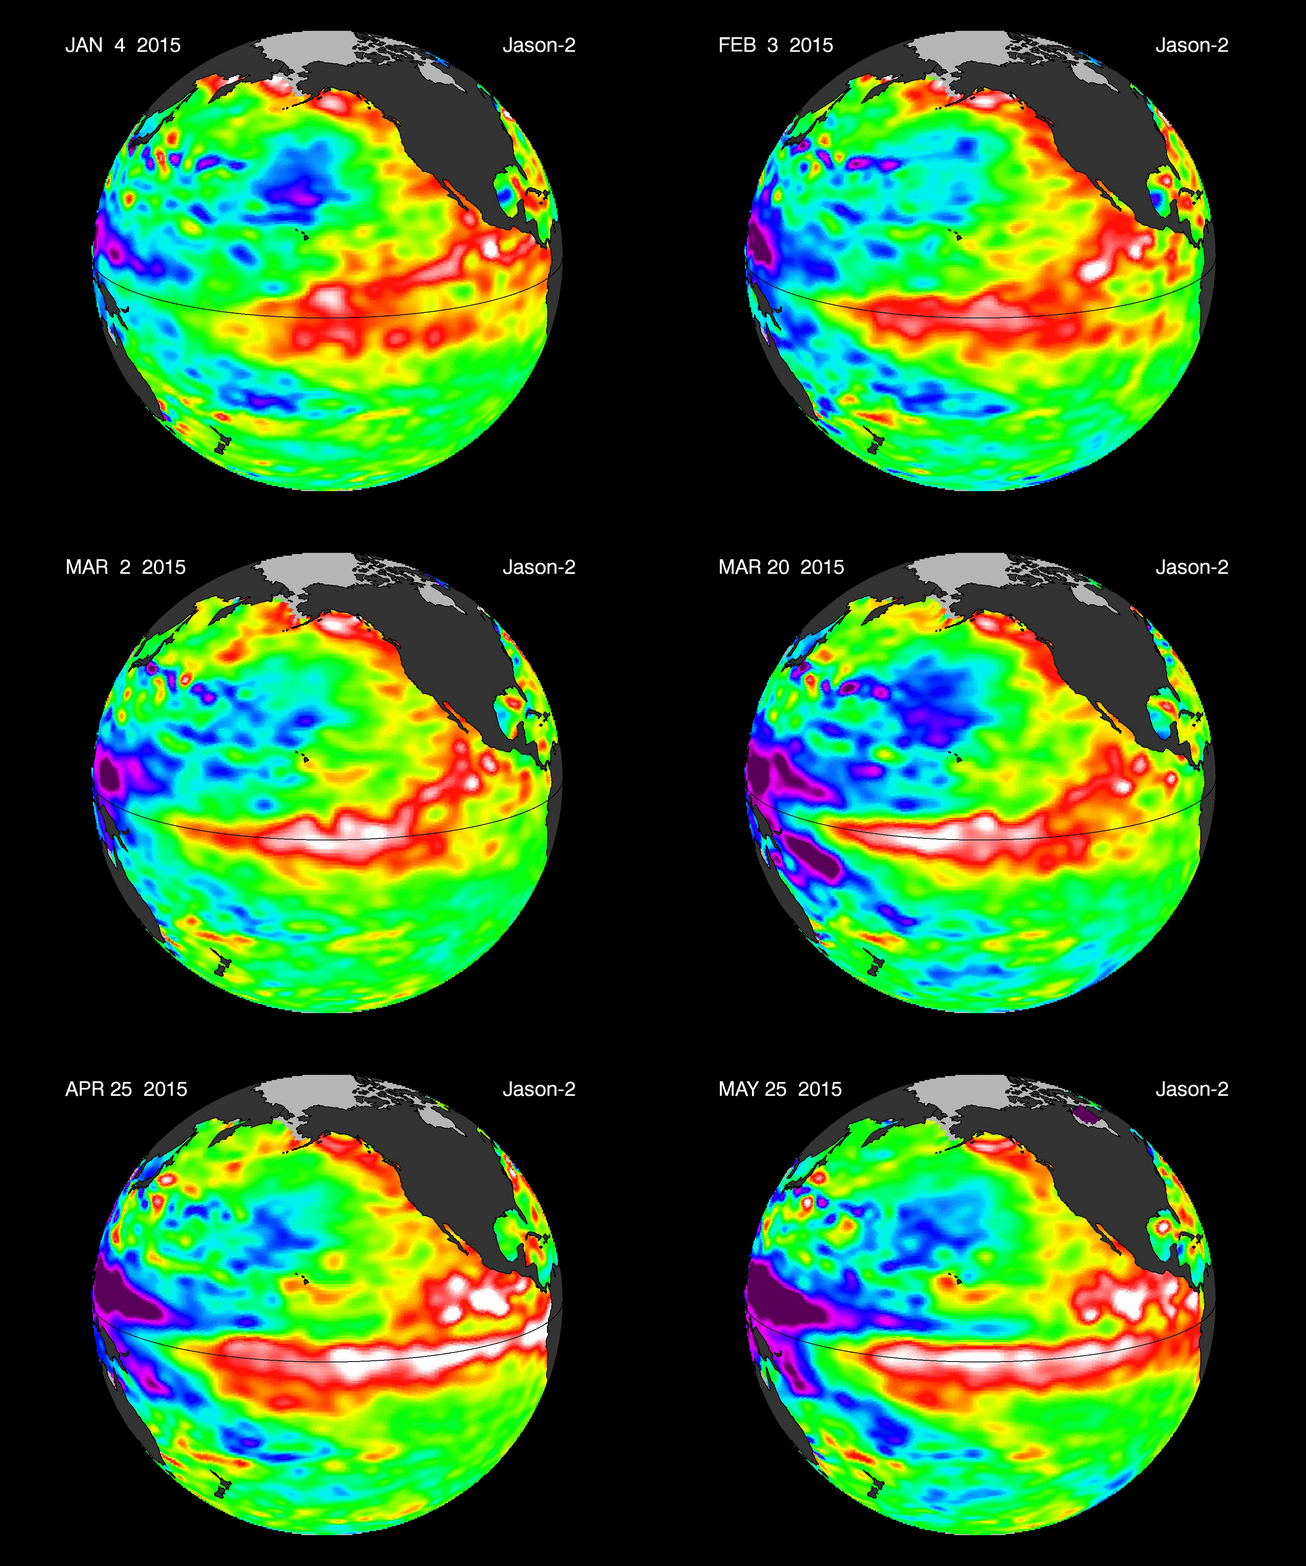
Anomaly Maps
- Anomaly maps show the difference from normal conditions
- Sea Surface Temperature (SST) anomaly maps are useful for identifying unusually warm or cool water
Typical El Niño impacts on New Zealand's climate
New Zealand typically experiences stronger or more frequent winds from the west in summer, leading to an elevated risk of drier-than-normal conditions in east coast areas and more rain than normal in the west—due to the barrier effect of the Southern Alps and main North Island ranges.
In winter, colder southerly winds tend to prevail, while in spring and autumn, south-westerlies tend to be stronger or more frequent, bringing a mix of the summer and winter effects.
During particularly strong El Niño phases, these effects can be more intense.

New Zealand also experiences drought in places that are normally dry (e.g. the canterbury plains), and floods elsewhere, thereby lowering agricultural output and real GDP. El Niño conditions usually coincide with a weak monsoon and rising temperatures in India, which hurts its agricultural sector and increases domestic food prices and inflation. El Niño–induced drought in Indonesia is also harmful to that country’s economy and agricultural sector, pushing up world prices for coffee, cocoa, and palm oil.
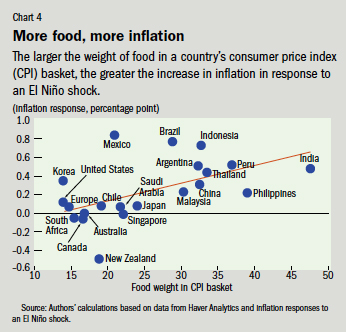
As shown above, New Zealand is the hardest hit by El Niño in the world due to our reliance on food grown in their own country and the major droughts that El Niño causes.
Tropical cyclones
Depending on its location and strength, a tropical cyclone is referred to by different names, including hurricane, typhoon, tropical storm, cyclonic storm, tropical depression, and simply cyclone.
"Tropical" refers to the geographical origin of these systems, which form almost exclusively over tropical seas. "Cyclone" refers to their winds moving in a circle, whirling round their central clear eye, with their winds blowing counterclockwise in the Northern Hemisphere and clockwise in the Southern Hemisphere.

Diagram of a Northern hemisphere hurricane

Saffir–Simpson scale
Saffir–Simpson scale
| Category |
Wind speeds
(for 1-minute maximum sustained winds) |
| m/s |
knots (kn) |
mph |
km/h |
| Five |
≥ 70 m/s |
≥ 137 kn |
≥ 157 mph |
≥ 252 km/h |
| Four |
58–70 m/s |
113–136 kn |
130–156 mph |
209–251 km/h |
| Three |
50–58 m/s |
96–112 kn |
111–129 mph |
178–208 km/h |
| Two |
43–49 m/s |
83–95 kn |
96–110 mph |
154–177 km/h |
| One |
33–42 m/s |
64–82 kn |
74–95 mph |
119–153 km/h |
Case Study Hurricane Katrina
Hurricane Katrina was a Category 5 tropical cyclone that occurred in August 2005, which caused $125 billion in damage, particularly in the city of New Orleans and the surrounding areas, and over 1,200 deaths. It is the costliest tropical cyclone on record, tying with Hurricane Harvey in 2017. The storm was the third major hurricane of the 2005 Atlantic hurricane season, and the fourth-most intense Atlantic hurricane on record to make landfall in the contiguous United States.

Map plotting the track and the intensity of the storm, according to the Saffir–Simpson scale
Flood Protection

Vertical cross-section of New Orleans, showing maximum levee height of 23 feet (7 m). The vertical scale exaggerated.
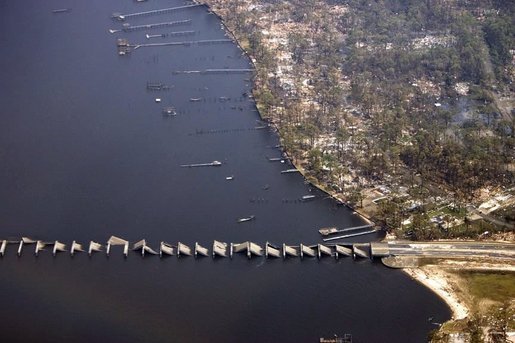
On August 29, 2005, Katrina's storm surge caused 53 breaches to various flood protection structures in and around the greater New Orleans area, submerging 80% of the city. A June 2007 report by the American Society of Civil Engineers indicated that two-thirds of the flooding was caused by the multiple failures of the city's floodwalls.
Ocean acidification
Ocean acidification is sometimes called “climate change’s equally evil twin,” and for good reason: it's a significant and harmful consequence of excess carbon dioxide in the atmosphere that we don't see or feel because its effects are happening underwater. At least one-quarter of the carbon dioxide (CO2) released by burning coal, oil and gas doesn't stay in the air, but instead dissolves into the ocean. Since the beginning of the industrial era, the ocean has absorbed some 525 billion tons of CO2 from the atmosphere, presently around 22 million tons per day.
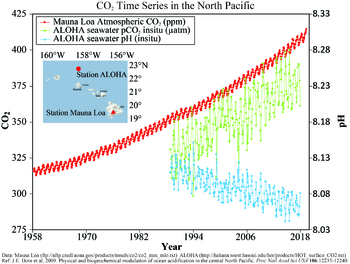
Scientists formerly didn’t worry about this process because they always assumed that rivers carried enough dissolved chemicals from rocks to the ocean to keep the ocean’s pH stable. (Scientists call this stabilizing effect “buffering.”) But so much carbon dioxide is dissolving into the ocean so quickly that this natural buffering hasn’t been able to keep up, resulting in relatively rapidly dropping pH in surface waters. As those surface layers gradually mix into deep water, the entire ocean is affected.

The acidic waters from the CO2 seeps can dissolve shells and also make it harder for shells to grow in the first place.
However, while the chemistry is predictable, the details of the biological impacts are not. Although scientists have been tracking ocean pH for more than 30 years, biological studies really only started in 2003, when the rapid shift caught their attention, and the term "ocean acidification" was first coined. What we do know is that things are going to look different, and we can't predict in any detail how they will look. Some organisms will survive or even thrive under the more acidic conditions while others will struggle to adapt, and may even go extinct.
Ocean Acidification the Great Barrier Reef
abiotic resources of oceans
Causes and consequences of increasing demand for the abiotic resources of oceans, including minerals, oil, and gas
Noise Production of Offshore Drilling
We often think of the ocean as a quiet, peaceful place, filled with animals that don't make much noise. So when I went diving in the ocean for the first time, I was surprised at how rich the soundscape around me was: you could hear fish nibbling on coral and squid swimming past you. But more than anything, you could almost always hear the hum of a boat engine. It's part of a big problem in the ocean right now. Ship traffic noise has doubled every decade since the 1960s — and it's wreaking havoc on marine life.
Seafloor mining
As the demand grows for the metals that power electronics, we may have to look farther and farther for mining opportunities. The next big mining frontier is the deep sea: along the seafloor, mysterious vents shoot scalding hot fluid into the ocean. These vents are a haven for miraculous and unique sea life, but they’re also home to highly concentrated (and very valuable) metals.
Ocean biotic resources
Trends in biotic resource use (fish and mammals) and the viability of alternatives to overfishing, including aquaculture, conservation areas, and quotas
Overfishing
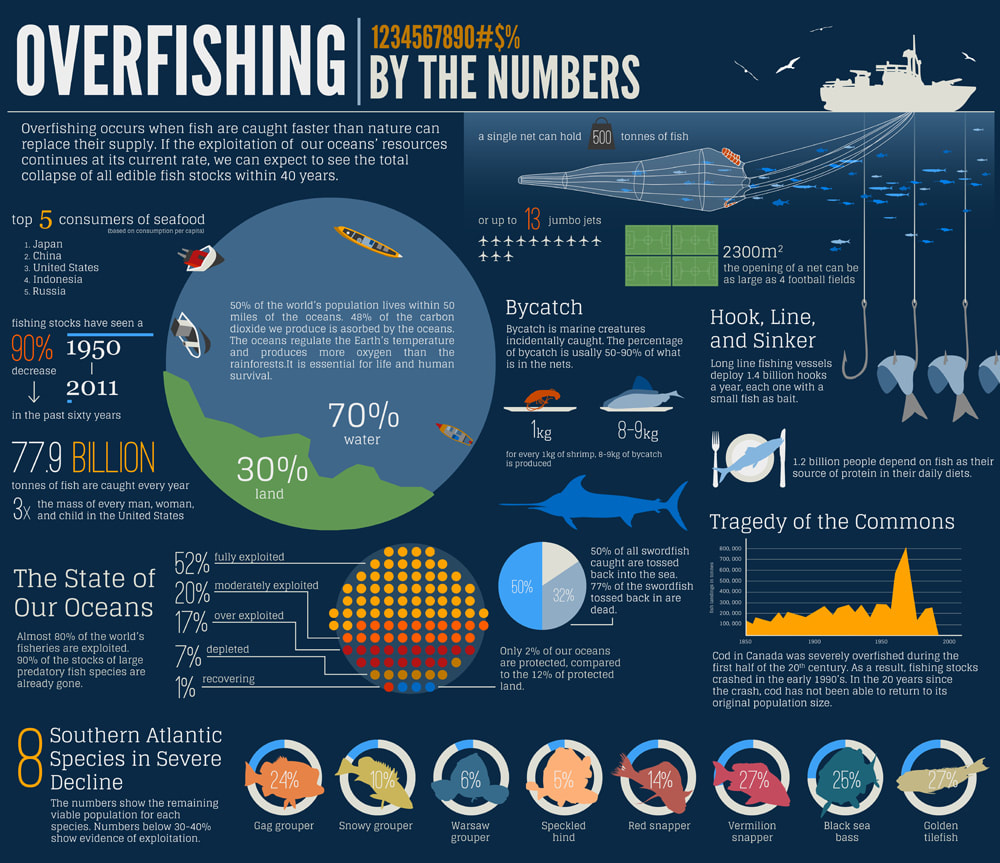
When most people think of fishing, we imagine relaxing in a boat and patiently reeling in the day’s catch. But modern industrial fishing -- the kind that stocks our grocery shelves -- looks more like warfare.
| Total (2018) |
93,736,944 |
101,084,799 |
199,741,129 |
 China China |
17,800,000 |
63,700,000 |
81,500,000 |
 Indonesia Indonesia |
6,584,419 |
16,600,000 |
23,200,000 |
 India India |
5,082,332 |
5,703,002 |
10,800,000 |
 Vietnam Vietnam |
2,785,940 |
3,634,531 |
6,420,471 |
 United States United States |
4,931,017 |
444,369 |
5,375,386 |
The tonnage from capture and aquaculture is listed by country. Includes fish, crustaceans, mollusks, etc.
Seafood and Algae

Across the United States, supermarkets sell ocean fish and shellfish. Most people, whether they realize it or not, eat seaweed, too. These ocean algae are commonly used to thicken cheese, ice cream, and pudding. The fishing industry uses huge nets bigger than football fields or lines of fishing hooks kilometers long to catch large amounts of fish at a time. As you read this sentence, tens of thousands of nets and fishing lines trail in the ocean. The fishing industry uses sonar, satellites, airplanes, and other technology to find areas in the ocean that contain large numbers of fish.
Aquaculture
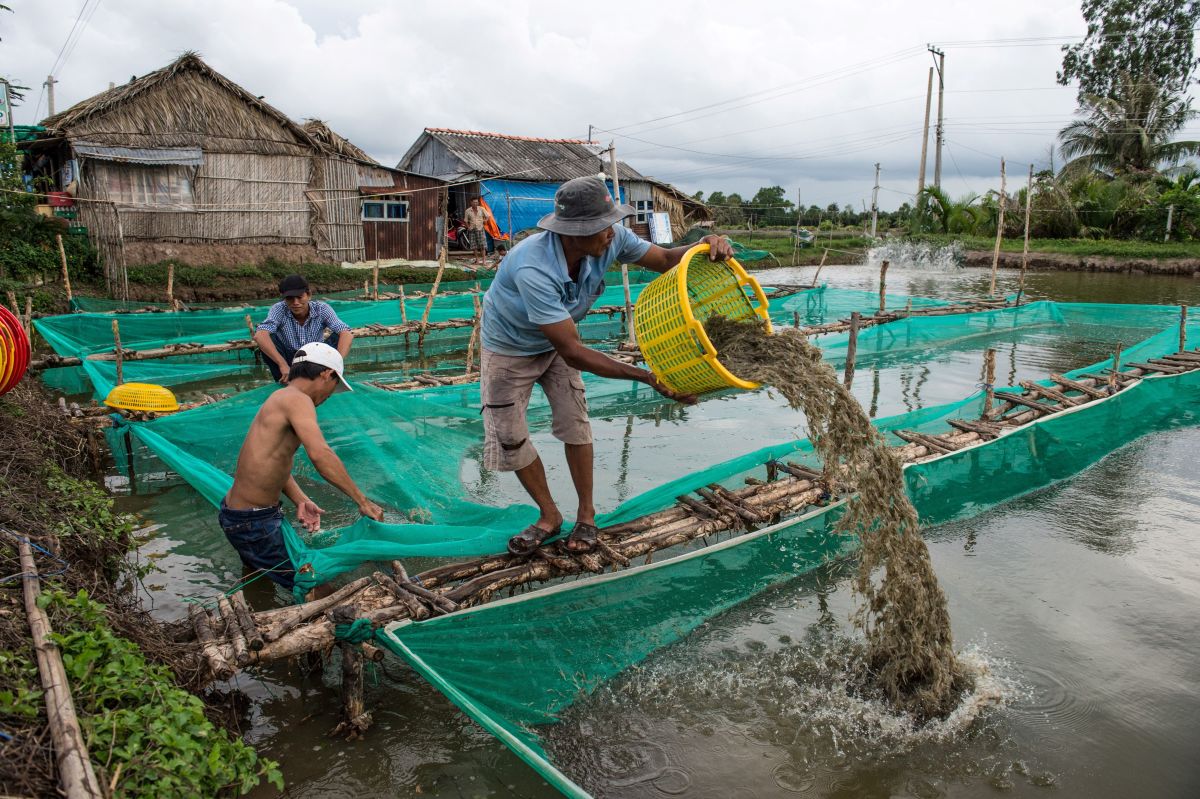
Aquaculture is the farming of both freshwater and ocean organisms. Saltwater farmers may raise fish, oysters, mussels, shrimp, seaweeds, or other organisms. Most aquaculture harms the environment. Huge amounts of fish waste are often released into the ocean waters surrounding fish farms, causing damage to plants and animals. Nutrients and chemicals added to water at fish farms may also end up in the ocean. Sometimes plants and animals are cleared from an area to make space for aquaculture. About half of the world’s mangrove forests have been cleared for shrimp farms and similar uses.
Ocean Pollution
Strengths and weaknesses of initiatives to manage ocean pollution, including local and global strategies for radioactive materials, oil, and plastic waste
Plastic Pollution
If we extrapolate historical trends through to 2050 — as can be seen in the chart here — by 2050, incineration rates would increase to 50 percent; recycling to 44 percent; and discarded waste would fall to 6 percent. However, note that this is based on the simplistic extrapolation of historic trends and does not represent concrete projections.
The Ocean Clean up Project
Oil Spills
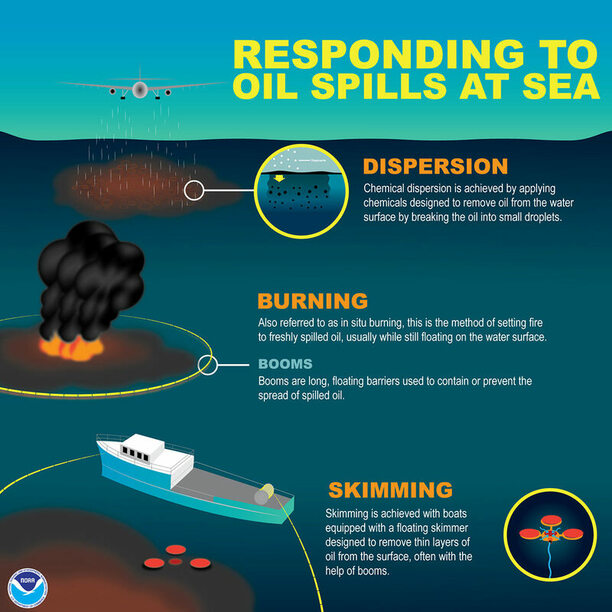
An oil spill occurs when liquid petroleum hydrocarbon is released into the environment, either in water or on land. Usually, when people talk about oil spills they are referring to those that occur in coastal waters or oceans, because of leaks from tankers, offshore drilling rigs or platforms, or wells. Oil spills are not only extremely damaging to the environment but they have a devastating effect on marine life and birds and animals that come into contact with the substance. The damage from an oil spill can be catastrophic to the environment, ecosystems, marine life, birdlife, and economies.
Oil destroys the insulating ability of fur-bearing mammals, such as sea otters, and the water repellency of a bird's feathers, thus exposing these creatures to the harsh elements. Without the ability to repel water and insulate from the cold water, birds and mammals will die from hypothermia.
Many birds and animals also ingest oil when they try to clean themselves, which can poison them.
Radioactive waste
From 1946 through 1993, thirteen countries (fourteen, if the USSR and Russia are considered separately) used ocean disposal or ocean dumping as a method to dispose of nuclear/radioactive waste. The waste materials included both liquids and solids housed in various containers, as well as reactor vessels, with and without spent or damaged nuclear fuel. Since 1993, ocean disposal has been banned by international treaties. (London Convention (1972), Basel Convention, MARPOL 73/78)

The Rainbow Warrior - a protest vessel that was used in the anti-nuclear movement
Possible Solutions
international conflicts
The strategic value of oceans and sources of international conflict/insecurity, including the contested ownership and control of island, canals and transit chokepoints
The UN's groundbreaking work in adopting the 1982 Law of the Sea Convention stands as a defining moment in the extension of international law to the vast, shared water resources of our planet. The convention has resolved several important issues related to ocean usage and sovereignty, such as:
- Established freedom-of-navigation rights
- Set territorial sea boundaries 12 miles (22.2 Km) offshore
- Set exclusive economic zones up to 200 miles offshore
- Set rules for extending continental shelf rights up to 350 miles offshore
- Created the International Seabed Authority
- Created other conflict-resolution mechanisms (e.g., the UN Commission on the Limits of the Continental Shelf)
Exclusive Economic Zone
In a countries EEZ it has sovereign rights over the living and non-living resources of the sea and seabed and other states have certain freedoms, including the freedoms of navigation and overflight.
The Artic
The ice in the Arctic is disappearing. Melting Arctic ice means new economic opportunities: trade routes in the Arctic ocean, and access to natural resources. Because of this, the Arctic nations are now moving to expand their border claims. Russia has shown that it’s the most ambitious, using a potent combination of soft power and military buildup to advance its agenda.

Check out more arctic maps from IBRU, Durham University, UK: http://www.durham.ac.uk/ibru/resource... /
Indian and Sri Lankan Fishing Disputes
Fishing is the economic lifeline for villages in northern Sri Lanka. But after a decades-long civil war, fishermen returned to find their fish stocks depleted – and they pointed the finger squarely at neighboring India. As Indian fishermen developed methods to increase hauls and crossed a maritime border that was more permeable during the war, they depleted the fish stock for both sides. Now, the Sri Lankan Navy is retaliating with force, only making the relationship between the two communities that rely on these waters worse.
Coastal management strategies
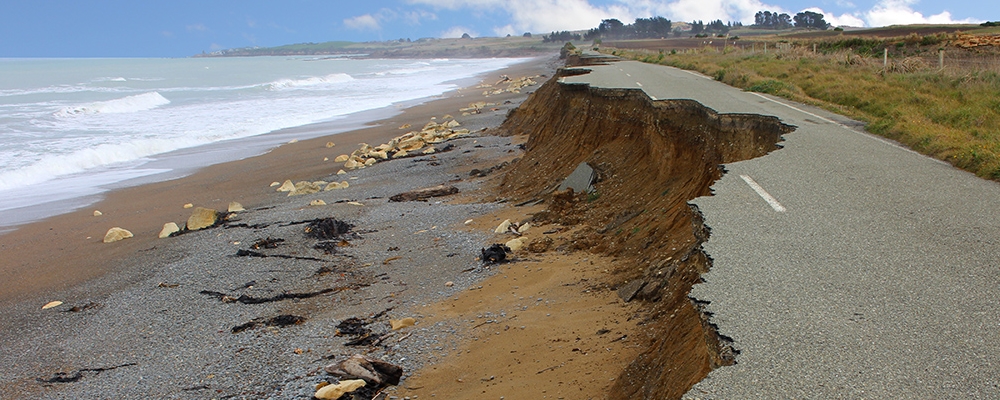
Coastal erosion and flooding management strategies, including cliff line stabilization and managed retreat
6 Figure Grid Reference
Exam question once required you to know it, so learn this.
Hard Engineering
Hard engineering options tend to be expensive, short-term options. They may also have a high impact on the landscape or environment and be unsustainable.
| Type of defense |
|
Advantages |
Disadvantages |
| Building a sea wall - a wall built at the edge of the coastline. |

|
Protects the base of cliffs, land, and buildings against erosion. It can prevent coastal flooding in some areas. |
Expensive to build. Curved sea walls reflect the energy of the waves back to the sea. This means that the waves remain powerful. Over time the wall may begin to erode. The cost of maintenance is high. |
| Building groins - a wooden barrier built at right angles to the beach. |
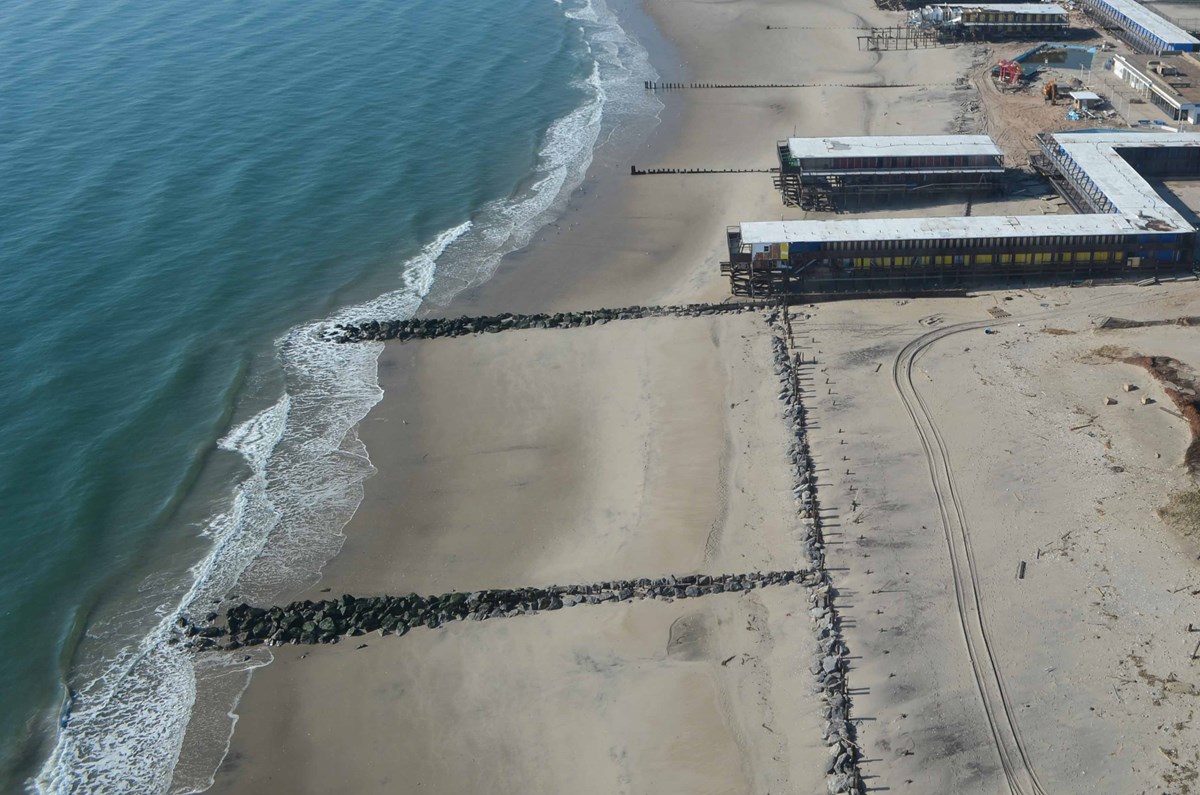 |
Prevents the movement of beach material along the coast by longshore drift. Allows the build-up of a beach. Beaches are a natural defense against erosion and an attraction for tourists. |
It can be seen as unattractive. Costly to build and maintain. |
| Rock armor or boulder barriers - large boulders are piled up on the beach. |
 |
Absorb the energy of waves. Allows the build-up of a beach. |
It can be expensive to obtain and transport boulders. |
Soft engineering options
Soft engineering options are often less expensive than hard engineering options. They are usually more long-term and sustainable, with less impact on the environment.
Beach nourishment
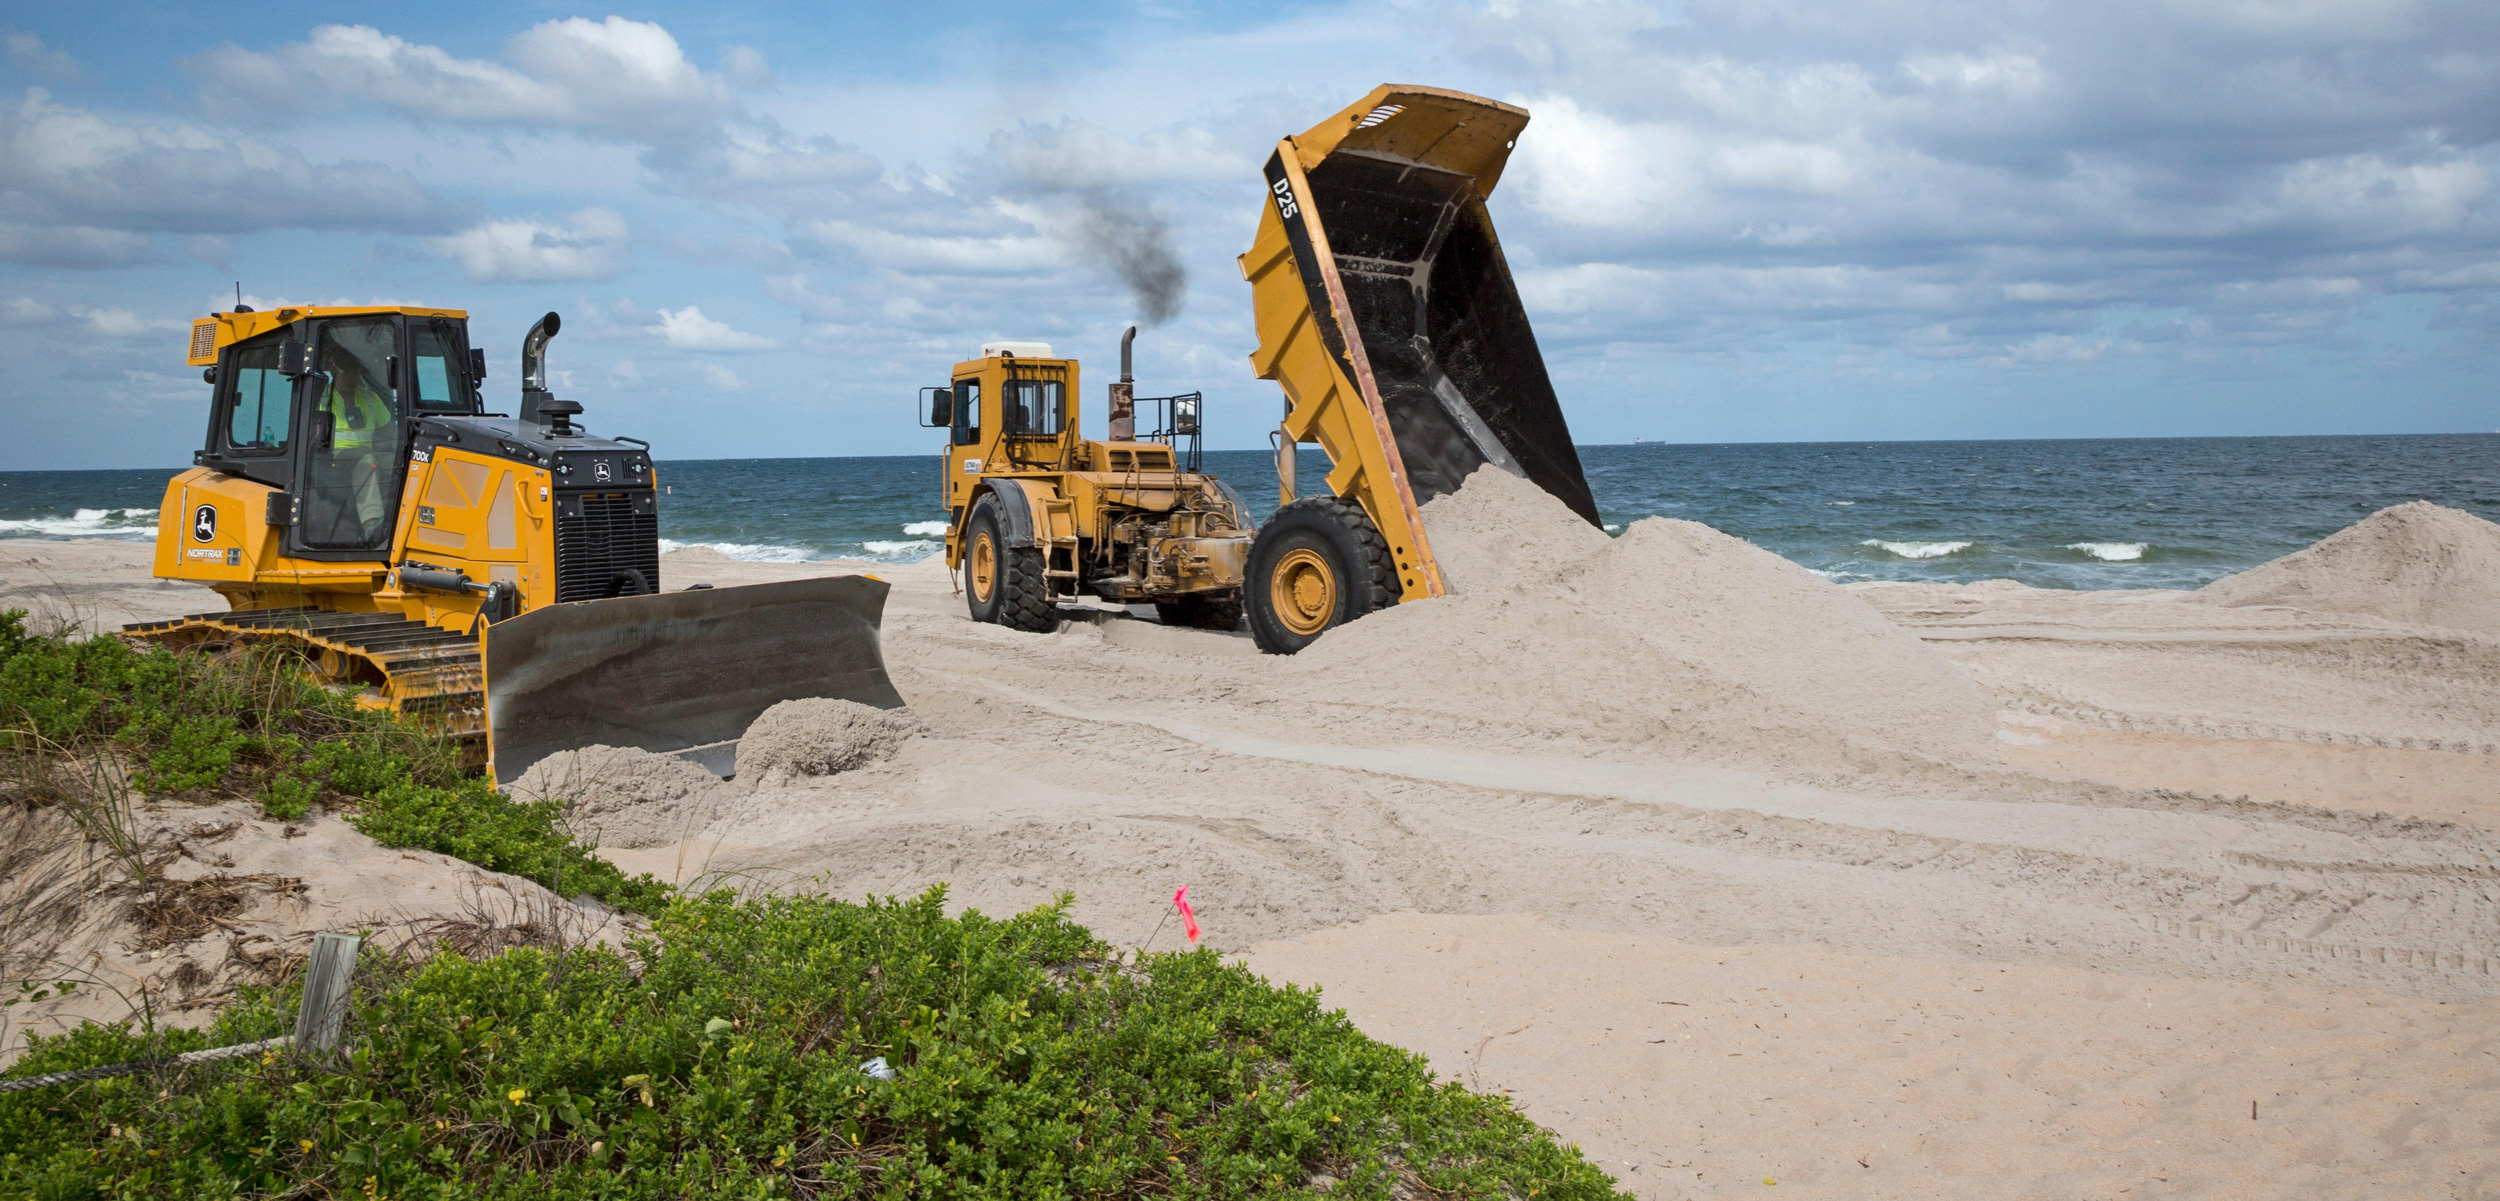
- This replaces beach or cliff material that has been removed by erosion or longshore drift.
- The main advantage is that beaches are a natural defense against erosion and coastal flooding. Beaches also attract tourists.
- It is a relatively inexpensive option but requires constant maintenance to replace the beach material as it is washed away.
Managed retreat

- Areas of the coast are allowed to erode and flood naturally. Usually, this will be areas considered to be of low value - eg places not being used for housing or farmland.
- The advantages are that it encourages the development of beaches (a natural defense) and salt marshes (important for the environment) and the cost is low.
- Managed retreat is a cheap option, but people will need to be compensated for the loss of buildings and farmland.
Case study: coastal management in Holderness
One coastal management case study focused on the decision-making process and perspectives of different actors
What causes the Holderness coastline to retreat?
- strong prevailing winds creating longshore drift that moves material south along the coastline
- the cliffs which are made of soft boulder clay, and will, therefore, erode quickly, especially when saturated.
The village of Mappleton, perched on a clifftop on the Holderness coast, has approximately 50 properties. Due to the erosion of the cliffs, the village is under threat.
The Mappleton Solution
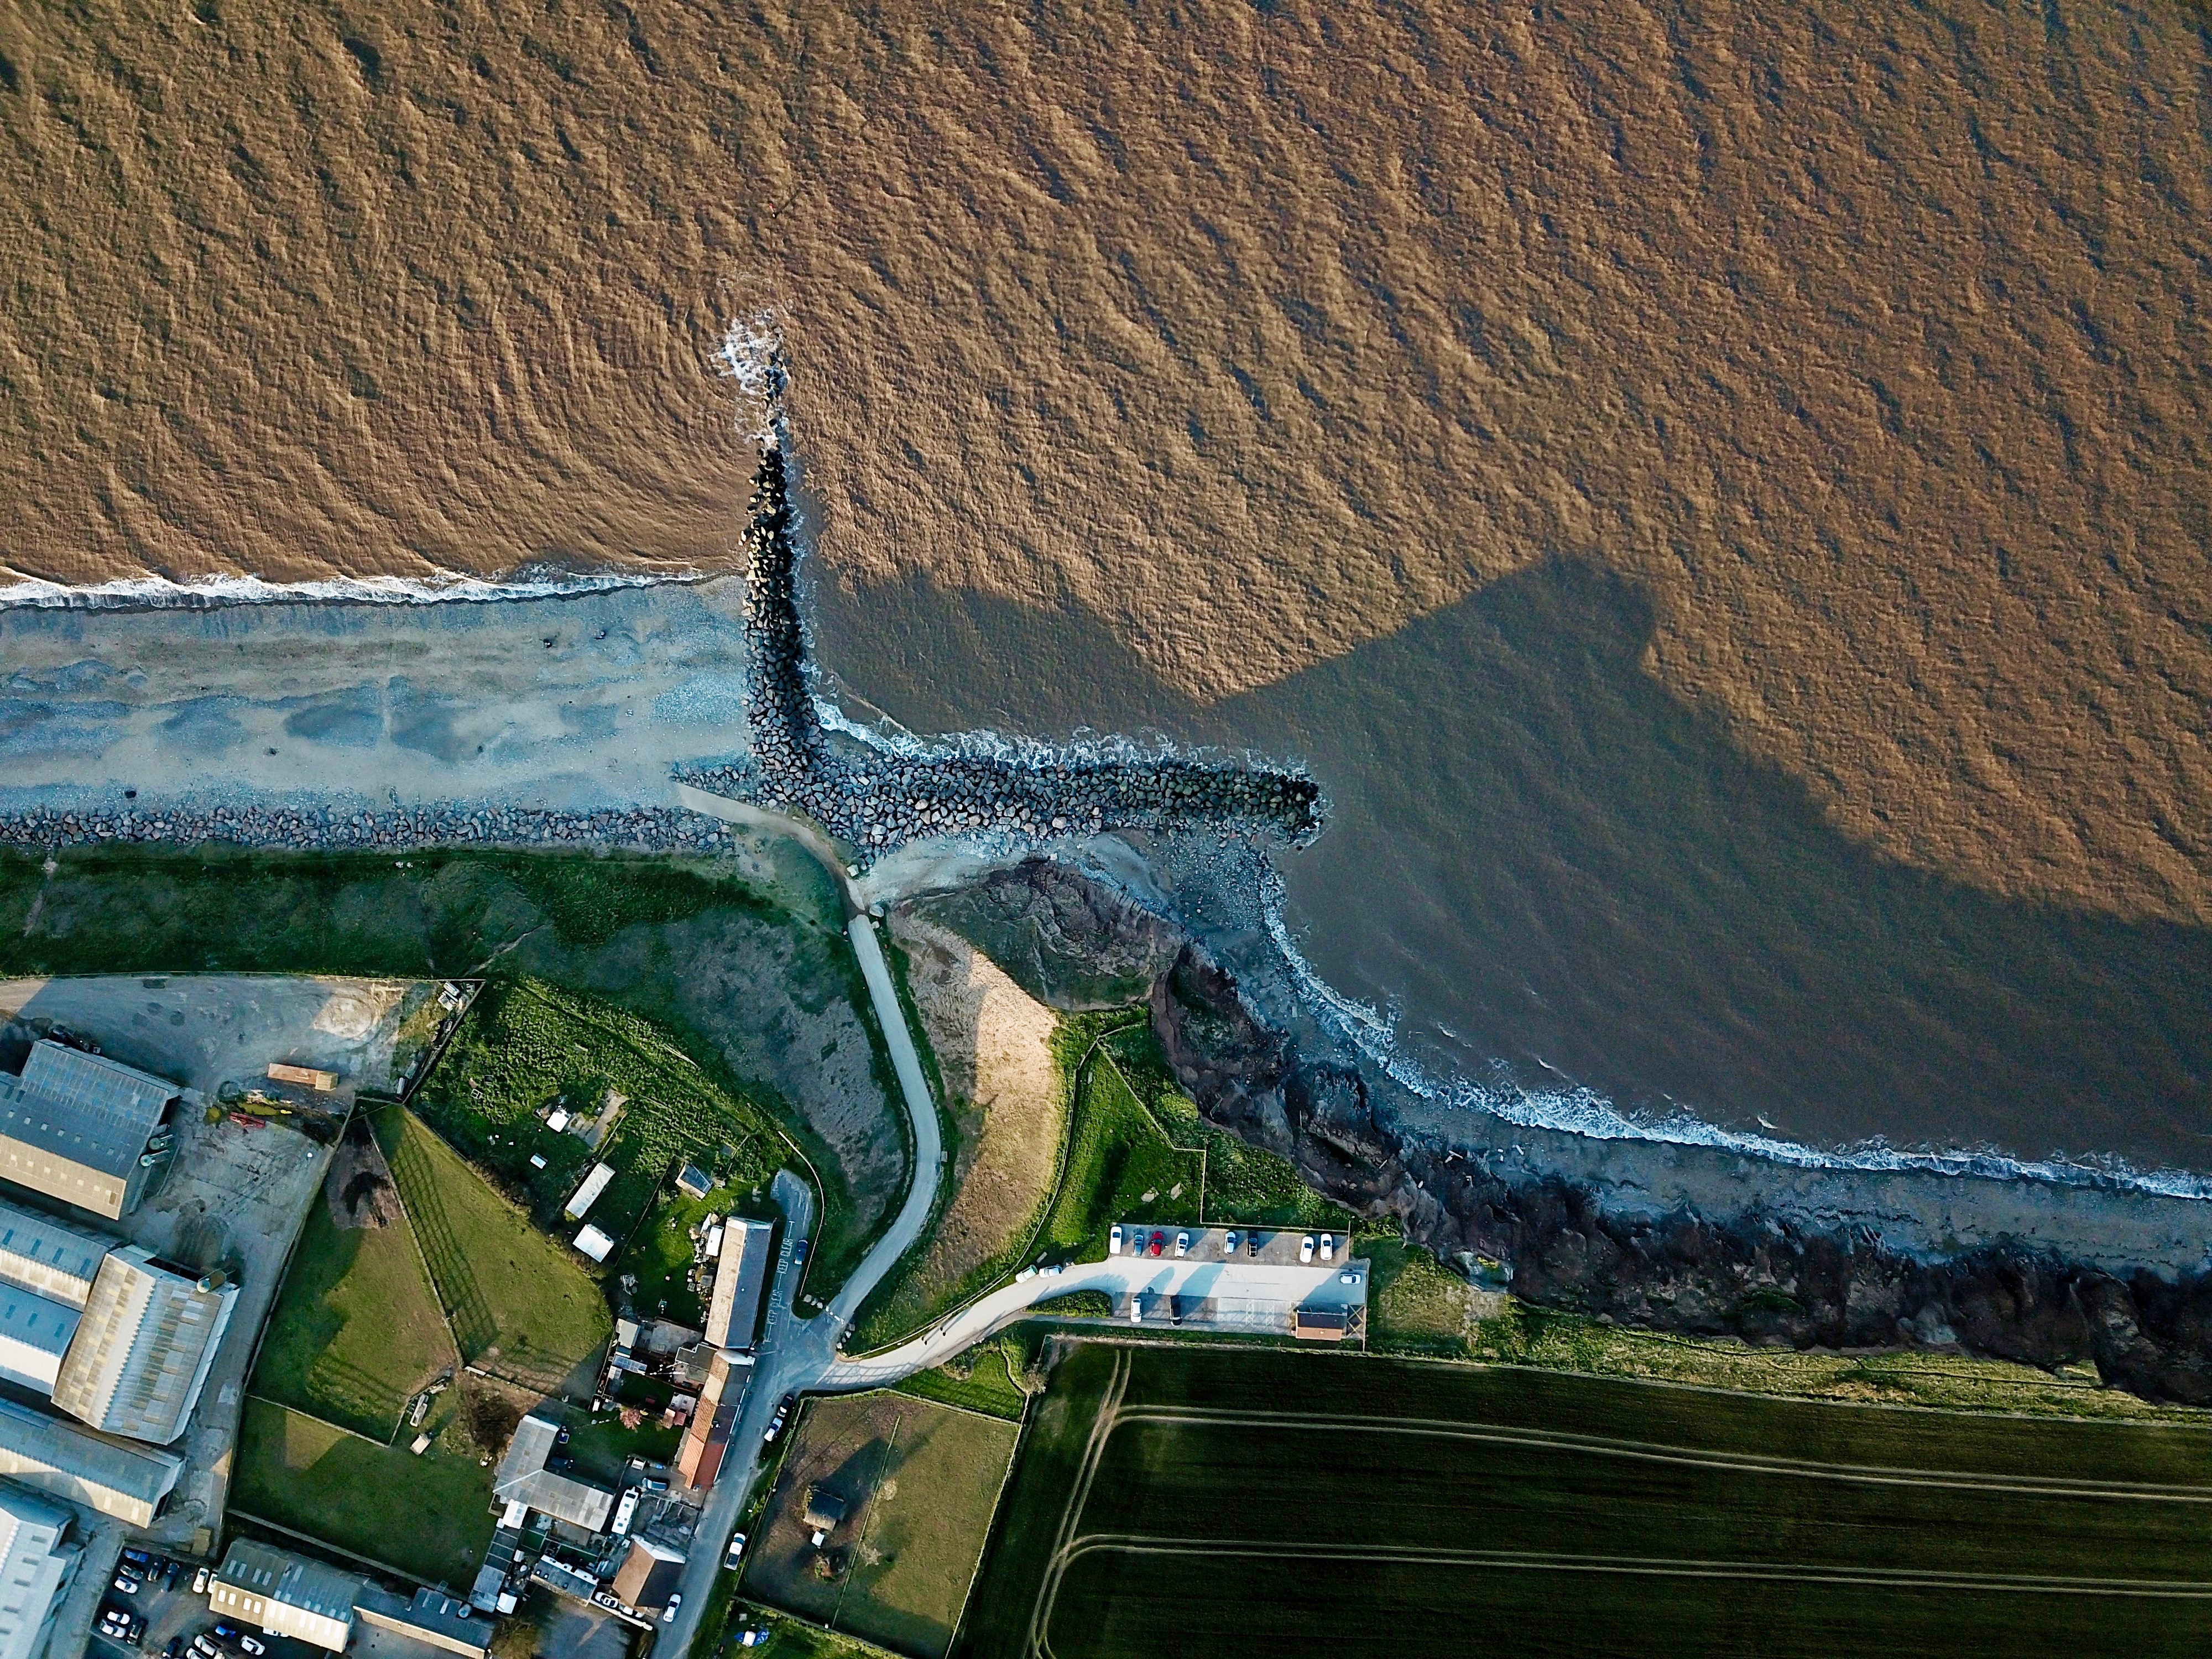
In 1991, the decision was taken to protect Mappleton. A coastal management scheme costing £2 million was introduced involving two types of hard engineering - placing rock armor along the base of the cliff and building two rock groynes.
- Mappleton and the cliffs are no longer at great risk from erosion.
- The rock groynes have stopped beach material being moved south from Mappleton along the coast. However, this has increased erosion south of Mappleton. Benefits in one area might have a negative effect on another.
The increased threat of sea-level rise due to climate change means that other places will need to consider the sustainability of coastal defense strategies for the future.
pressures on coastlines
Conflicting land-use pressures on coastlines, including commercial land, uses (tourism, industry, and housing) and conservation measures
Management of reefs and mangroves
Management of coral reefs and mangrove swamps, including different stakeholder perspectives on their use and value
• Detailed examples of both ecosystems and their issues
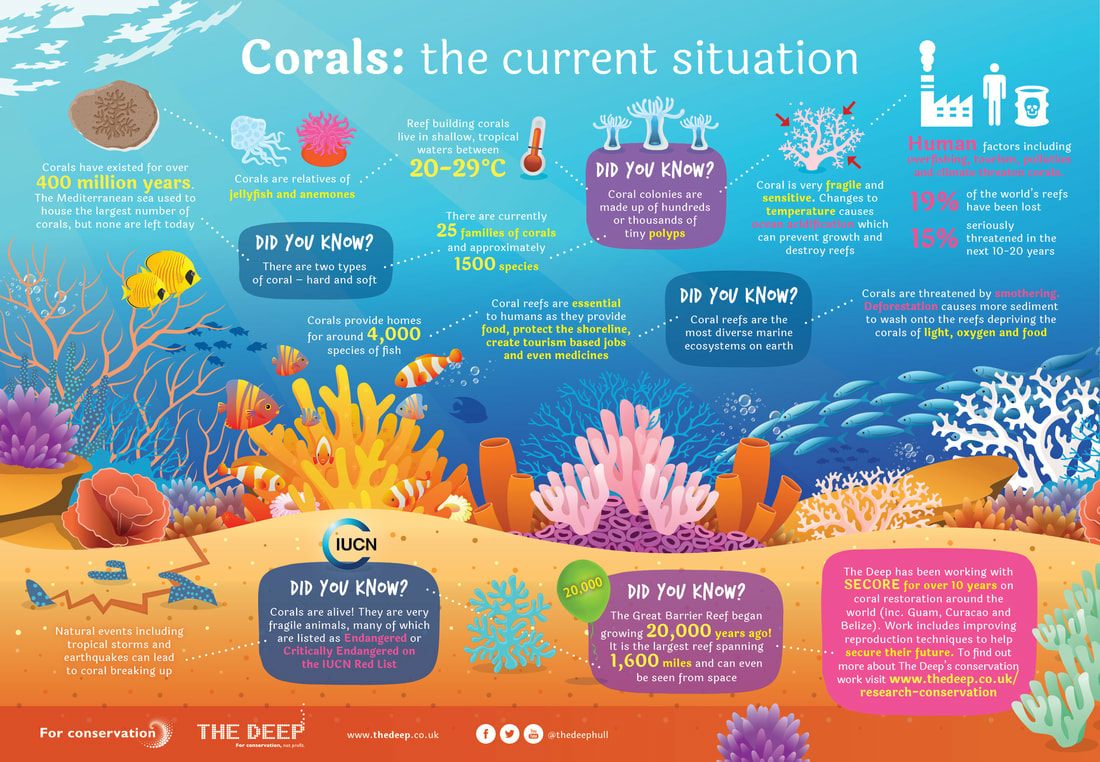
Coral Reef Management
Mangrove Swamp Management
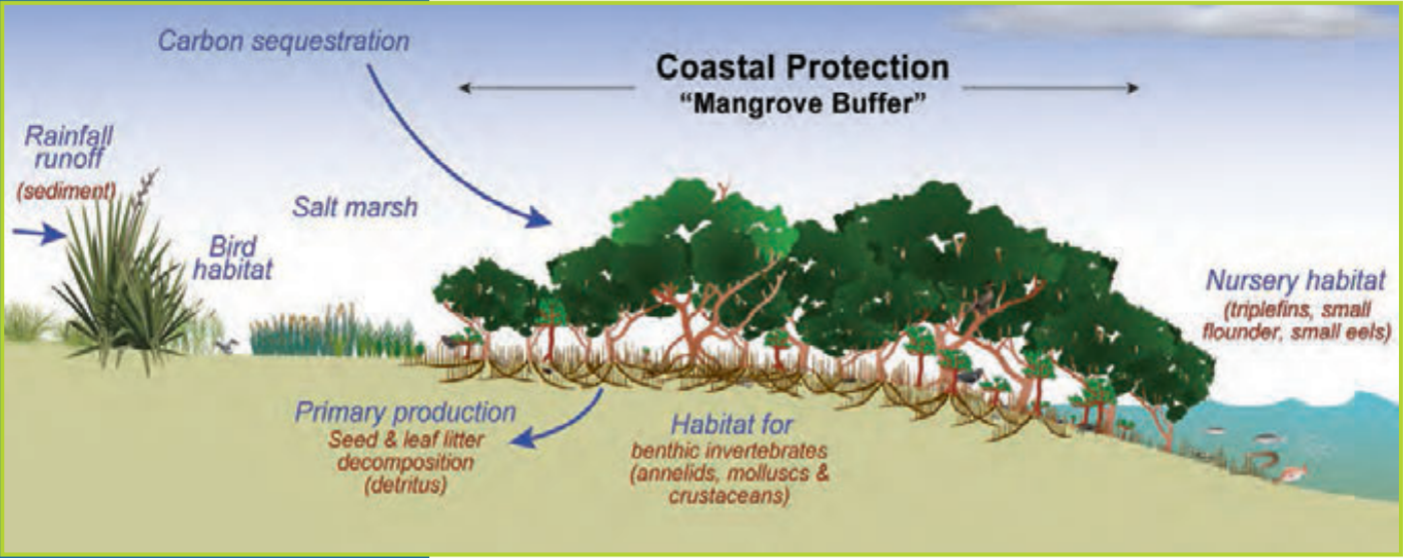
A mangrove is a shrub or small tree that grows in coastal saline or brackish water. The term is also used for tropical coastal vegetation consisting of such species. Mangroves occur worldwide in the tropics and subtropics, mainly between latitudes 25° N and 25° S. The total mangrove forest area of the world in 2000 was 137,800 square kilometers (53,200 sq mi), spanning 118 countries and territories.

Adequate data are only available for about half of the global area of mangroves. However, of those areas for which data has been collected, it appears that 35% of the mangroves have been destroyed. The United Nations Environment Programme estimates that shrimp farming causes approximately a quarter of the destruction of mangrove forests.
In NZ, councils are tasked with finding a balance between the objectives of many community groups
seeking mangrove removal and the environmental effects of removals. The arguments put forward by mangrove removal proponents are numerous, including visual, amenity, recreational, cultural, and ecological.
There is no published literature that clearly links ecological enhancement with mangrove removal in New Zealand. There is, however, evidence that identifies significant adverse environmental effects associated with mangrove removal.
Apparently unforeseen significant adverse effects from mangrove removal activities continue to occur. For example, in an estuary in Tauranga in March 2015, where a machine become stuck in benthic sediment, inundated at high tide, and had to be dragged out using a crane. Removal of the machinery is likely to have caused significant disturbance and damage to the benthos and coastal vegetation.

View count: 11403