Units
7 Fundamental units
| Measurement |
Unit |
Symbol |
| Time |
Second |
s |
| Displacement |
Metre |
m |
| Mass |
Kilogram |
Kg |
| Current |
Ampere |
A |
| Temperature |
Kelvin |
K |
| Amount of substance |
Mole |
mol |
| Luminous Intensity |
Candela |
cd |
Derived quantities
To convert between the derived and fundamental units, look at the formula and substitute the units.
E.g Momentum has derived unit - p.
To find fundamental, substitute units into the formula.
p = mass*velocity = kgms-1
Dimensional consistency
This is checking if the units are correct for measurement by converting it to fundamental units and seeing if it fits the equation.
E.g are the units for velocity at2?
ms-1 ≠ ms-2s2 Therefore this is not dimensionally consistent.
Metric multipliers and si prefixes
| Factor |
Name |
Symbol |
Factor |
Name |
Symbol |
| 101 |
deca |
d |
10-1 |
deci |
d |
| 102 |
hecto |
h |
10-2 |
centi |
c |
| 103 |
kilo |
k |
10-3 |
milli |
m |
| 106 |
mega |
M |
10-6 |
micro |
μ |
| 109 |
giga |
G |
10-9 |
nano |
n |
| 1012 |
tera |
T |
10-12 |
pico |
p |
| 1015 |
peta |
P |
10-15 |
femto |
f |
Order of magnitude
The nearest power of 10.
6.5 x 10⁵ has a magnitude of 106 because 6.5 rounds up to 10.
Significant figures
Your answer must be to least precise significant figures in the question you were asked.
Uncertainties
What is uncertainty
This is how much a value measured may vary from the actual value.
Absolute uncertainty: the same units as the measurements
percentage uncertainty: Given as a percentage as measurement
Precise Vs Accurate

Uncertainties Practical
IB Physics: Optional Practical: Density of plasticine
Types of error
| Type |
Description |
Effect on the graph |
| Random |
Changes every trial |
The best fit line will not pass through all the error bars. |
| Systematic |
Caused by equipment, which is constant for every trial. |
Shifts graph vertically or/and horizontally. Error bars represent this error. |
Rules to determine the uncertainty
Rounding: 1 sig fig on exam OR don't round for lab report
Averages: Range / 2
Analog Measurements: For reliable equipment use plus or minus half smallest division (rounded to 1sf) or the uncertainty listed on the equipment.
Combining Uncertainties
Added or subtracted
Add the absolute uncertainty
Multiplied or divided
Add the percentage uncertainty
Raised to a power
Times the percentage uncertainty by the power (X) of the equation
Determine the uncertainty of a series
Calculate the range of values using the min and max value (not the uncertainty).
Determine the uncertainty of x number of oscillations
Divide the absolute uncertainty by the number of oscillations.
Trigonometric Uncertainty
Calculate the range of values using the min and max value (normal plus and minus the uncertainty).
Exam Tip
Do not expend a great lot of effort in expressing uncertainties during an examination, unless specifically instructed. Assess the evidence, use common sense, and (generally) round-off absolute uncertainty to one significant figure. An uncertainty of ±0.389s can be rounded to ±0.4s to agree with the least significant digit position in the measured value.
Uncertainty graphs
Gradient uncertainty: (Maximum gradient - the minimum gradient)/2
Y-intercept: Maximum/minimum y-intercept - best fit y-intercept (largest difference determines maximum or minimum)
Error bars: Shows the uncertainty of the best line based on the systematic error.
Vectors
What are Vectors and Scalars?
A vector is a way of representing a quantity with both magnitude and direction. It can be represented in two ways. Either the magnitude is stated directly, then it's direction is given as an angle from something. This is useful when working with a polar coordinate system.
Vector: Magnitude and direction
Scalar: ONLY magnitude
Examples of vectors and scalars
|
Vectors
|
Scalars
|
|
velocity
|
Mass
|
|
displacement
|
Time
|
|
Weight
|
Distance
|
|
Acceleration
|
Length
|
Difficult to remember Vector and scalars quantities
- Electric field strength - Vector
- Current - Scalar
- Work - Scalar
Ways of representing a vector
- A plus or minus next to the magnitude
- An arrow next to the magnitude
- A direction next to the magnitude
- An angle next to the magnitude (angles always starting from positive x-axis like a unit circle)
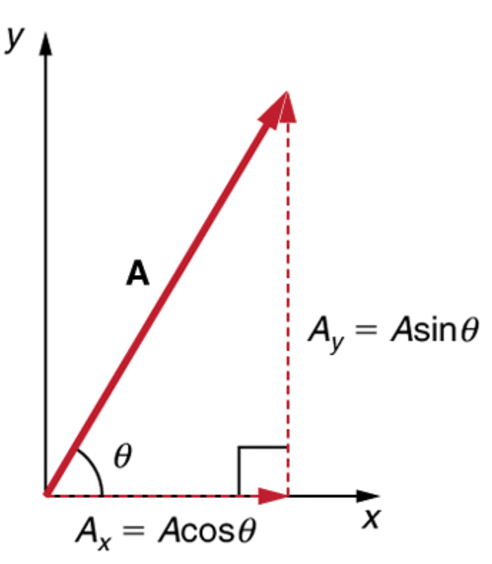
Horizontal and Vertical Components
Split each component into its horizontal and vertical components using trigonometry. Then for each axis add the components together.
Vector addition and subtraction graphically:
To add two vectors, draw the first vector with its tail at the origin and then draw the second vector with its tail at the previous vectors head. Finally, draw a line from the origin to the head of the second vector. This line is the new vector, as shown below.
W= U+V
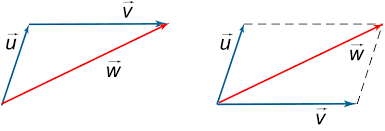
To subtract a vector, do the same as with addition but flip the vector which you are subtracting.
Practise Test
Here is a practise test I put together. It is 1hr long and made from V3 Past exam questions.
https://drive.google.com/file/d/1SxW4rSdmN5T4j08TqpJ9cBx3Py5JNOnI/view?usp=sharing
Editors- joeClinton - 357 words.
- CD_FER - 570 words.
View count: 12242