Free trade
The benefits of trade
- Lower prices for consumers - Foreign countries can sell certain goods and services at lower prices which the domestic market must compete with.
- Greater choice for consumers - Consumers are not restricted to just their domestic market for choice of goods.
- Producers benefit from economies of scale - As producers can sell to the larger market they can take advantage of the economies of scale.
- Acquire needed resources - Some countries don't have access to the resources they need to live so they have to trade with other countries. E.g saudia arabia imports food because they can't grow food well in their climate
- More efficient allocation of resources - Countries can allocate resources towards area which they have an absolute advantage at and export in this market, then they can import in the area they lack in. E.g Switzerland exports watches and imports oil.
Absolute and comparative advantage
Absolute advantage: when a country can produce a good more efficiently than other countries.
Comparative advantage: when a country can produce a good at a lower opportunity cost than another country can.
It is important to be able to distinguish between the two. The absolute advantage comes when countries benefit from lower marginal costs on the product than another country however this does not mean they should export this product. When choosing what product they should export they should look at the comparative advantage which they have which refers to the advantage in opportunity cost. One should import goods if the opportunity cost of importing is lower than producing them locally.

World trade Organisation
The World trade Organisation is an international organisation which deals with trade rules between its member countries. It aims to promote free trade and improve the flow of trade.
There functions are:
- Settle trade disputes
- Provide legal rules for trading
- provide a place for international traders to negotiate.
- Keep trade liberalized.
Trade protection
Types of trade protection
Without trade protection
Diagram

Stakeholders before trade protection
| Stakeholder |
Areas on diagram |
| Domestic producers |
Quantity produced: Q1. Quantity determined by the domestic supply curve intersection with world price.
Producer Surplus: area below the world price and above the supply curve domestic (Blue area)
Revenue: Q1 * Pw
|
| Foreign producers |
Quantity produced: Q4-Q1. Quantity of goods which is in shortage.
|
| Consumers |
Quantity demanded: Q4. Quantity determined by demand curve, intersection with world price.
Consumer Surplus: area above world price and below demand curve. (Red area)
|
Tariffs
Tariffs are where a country will tax imports. This makes it more expensive for foreign producers to export their goods into the country so they will raise their prices. Now the world price is easier for domestic producers to compete with, so the domestic supply increases.
Tariff diagram
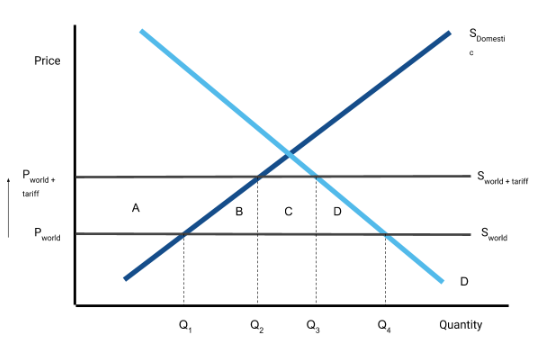
The diagram is quite important. The main idea is to draw a micro-economics supply and demand diagram then draw two horizontal lines. One for price world / supply world and another higher up for price world + tariff / supply world + tariff.
Stakeholder analysis
| Stakeholder |
Effect of Trade protection |
| Domestic producers |
Quantity produced: Q2. With the higher world price producers can afford to sell at a higher price so quantity supplied increases.
Surplus Gain: area A
|
| Foreign producers |
Quantity: Q3-Q2. Quantity of goods which is in shortage decreases, and demand decreases. |
| Consumers |
Quantity demanded: Q3. New price moves causes a movement along demand curve.
Surplus Loss: area A + B + C + D
|
| Government |
Revenue gain: (Q3-Q2)*Pt The tariff revenue is the quantity imported multiplied by the tariff price. |
|
Deadweight welfare loss
|
Looking at the changes in surplus we see there is a loss for consumers but a gain for producers and the government. So subtracting gains from losses we get
Welfare loss = A + C - (A+B+C+D) = B+D
|
|
Productive inefficiency
|
This is the cost to the country caused by producing the product more inefficiently than another country could produce it.
= B
|
Quotas
This is a direct restriction on the amount of imports of a good allowed. This creates an artifical shortage as the only supply in the country is the domestic + the quota which is below the quantity demanded by consumers. But using micro-economic principles the price then increases until supply matches demand.
Diagram
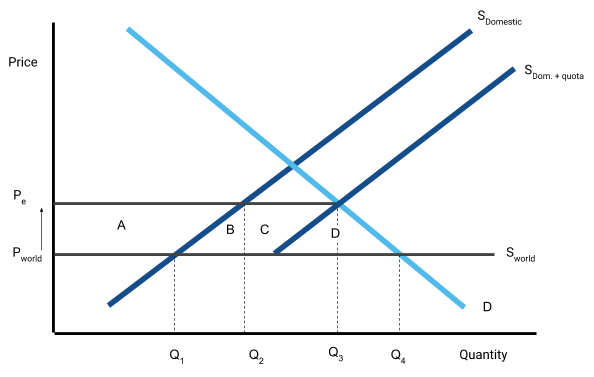
Note: The domestic + quota supply curve does not go below the world price because domestic producers can't produce below that level.
Stakeholder analysis
| Stakeholder |
Effect of Trade protection |
| Domestic producers |
Quantity produced: Q2. With the higher world price producers can afford to sell at a higher price so quantity supplied increases.
Surplus Gain: area A
|
| Foreign producers |
Quantity: Q3-Q2. They can only export the quota quantity |
| Consumers |
Quantity demanded: Q3. New price moves causes a movement along demand curve.
Surplus Loss: area A + B + C + D
|
| Government |
Revenue gain: They don't gain any revenue |
|
Deadweight welfare loss
|
Looking at the changes in surplus we see there is a loss for consumers but a gain for producers. However unlike tariffs none of the consumer welfare loss is regained by the government
Welfare loss = A - (A+B+C+D) = -(B+C+D)
|
|
Productive inefficiency
|
This is the cost to the country caused by producing the product more inefficiently than another country could produce it.
= B
|
Subsidies
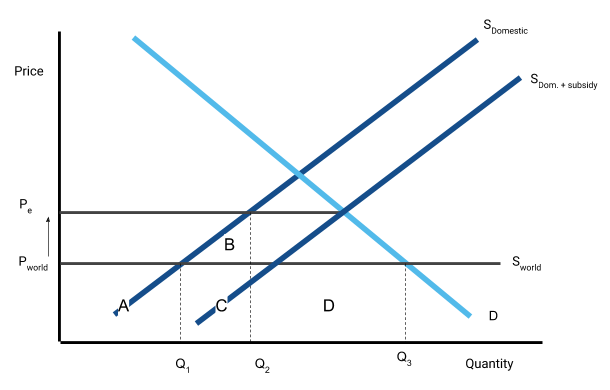
A subsidy is a government payment to domestic producers, per unit of output, in order to lower the price of produce and increase the quantity supplied. This helps domestic producers compete with the foreign producers.
Importantly this does not cause a change in the price of the good from the world price.
Diagram
Stakeholder analysis
| Stakeholder |
Effect of Trade protection |
| Domestic producers |
Quantity produced: Q2. With the subsidy domestic producers can supply more for the same price.
Surplus Gain: Area below world price and above new supply curve
Revenue gain: C + (Q2*subsidy) They also gain the subsidy itself.
|
| Foreign producers |
Quantity: Q3-Q2. They produce to fill the shortage quantity. |
| Consumers |
Quantity demanded: Q3. Price has not changed so consumers still demand the same amount.
Surplus Loss: None (Price hasn't changed)
|
| Government |
Revenue Loss: Q2 * subsidy (They have to pay the subsidy) |
|
Deadweight welfare loss
|
Looking at the changes in surplus we see there is no change for consumers but a gain for producers.
Welfare loss = B
|
Arguments for and against trade protection
Arguments For trade protection
Dumping: Foreign firms selling goods at a price below the market price inorder to flood the market.
- Protects domestic jobs - if domestic industry grows domestic employment increases
- National security - Sometimes trading can conflict with a countries defence. E.g America imposes tariffs on steel to give America an advantage if it came to war.
- Protection of infant industries - Sometimes industries (often in LEDC's) may need time to develop and build experience and economies of scale but they need temporary protection to do so.
- Health standards - Countries differ on their standards of health. E.g rat droppings may be allowed in US cereal but not by EU standards.
- anti-dumping - If a competing country is dumping then, trade protection can be a effective method to fight this.
- overcoming a balance of payments deficit - if country imports more than it exports, trade protection will help balance this by decreasing imports.
- source of government revenue - This applies to Tariffs on imports where the government earns tax revenue
- Complementary industries thrive - As well as the industries focused on by the question, other industries may benefit from an increase in quantity produced in that industry.
Arguments Against trade protection
- Misallocation of resources - Rather than protecting the industries they can't compete in they should specialize in the ones that they have a comparative advantage.
- The danger of retaliation and “trade wars” - If a country imposes trade barriers there is the danger the other country will retaliate and impose their own trade barriers. This can cause uncertainty and other negative economic effects.
- Increase costs for consumers
- Decreased competitiveness
View count: 28512