Fuel types
| |
Advantages
|
Disadvantages
|
|
Fossil Fuels
|
- Easy to Transport
- Cheap
- Easy to use
-
|
- Emissions
- Rising at volatile cost
- Population
|
|
Nuclear
|
- Relatively Cheap
- Low running costs
- Small land area
- Low dependence on other resources
-
|
- Unpopular
- High initial cost
- Highly toxic waste
-
|
|
Hydro
|
- Low running cost
- Easy to use
- No emissions
-
|
- High land use
- Costly to setup
- Dependent on a volatile resource
|
|
Other Renewables
|
- No emissions
- Low running cost
-
|
- Costly
- Still in development
|
Case Studies
| |
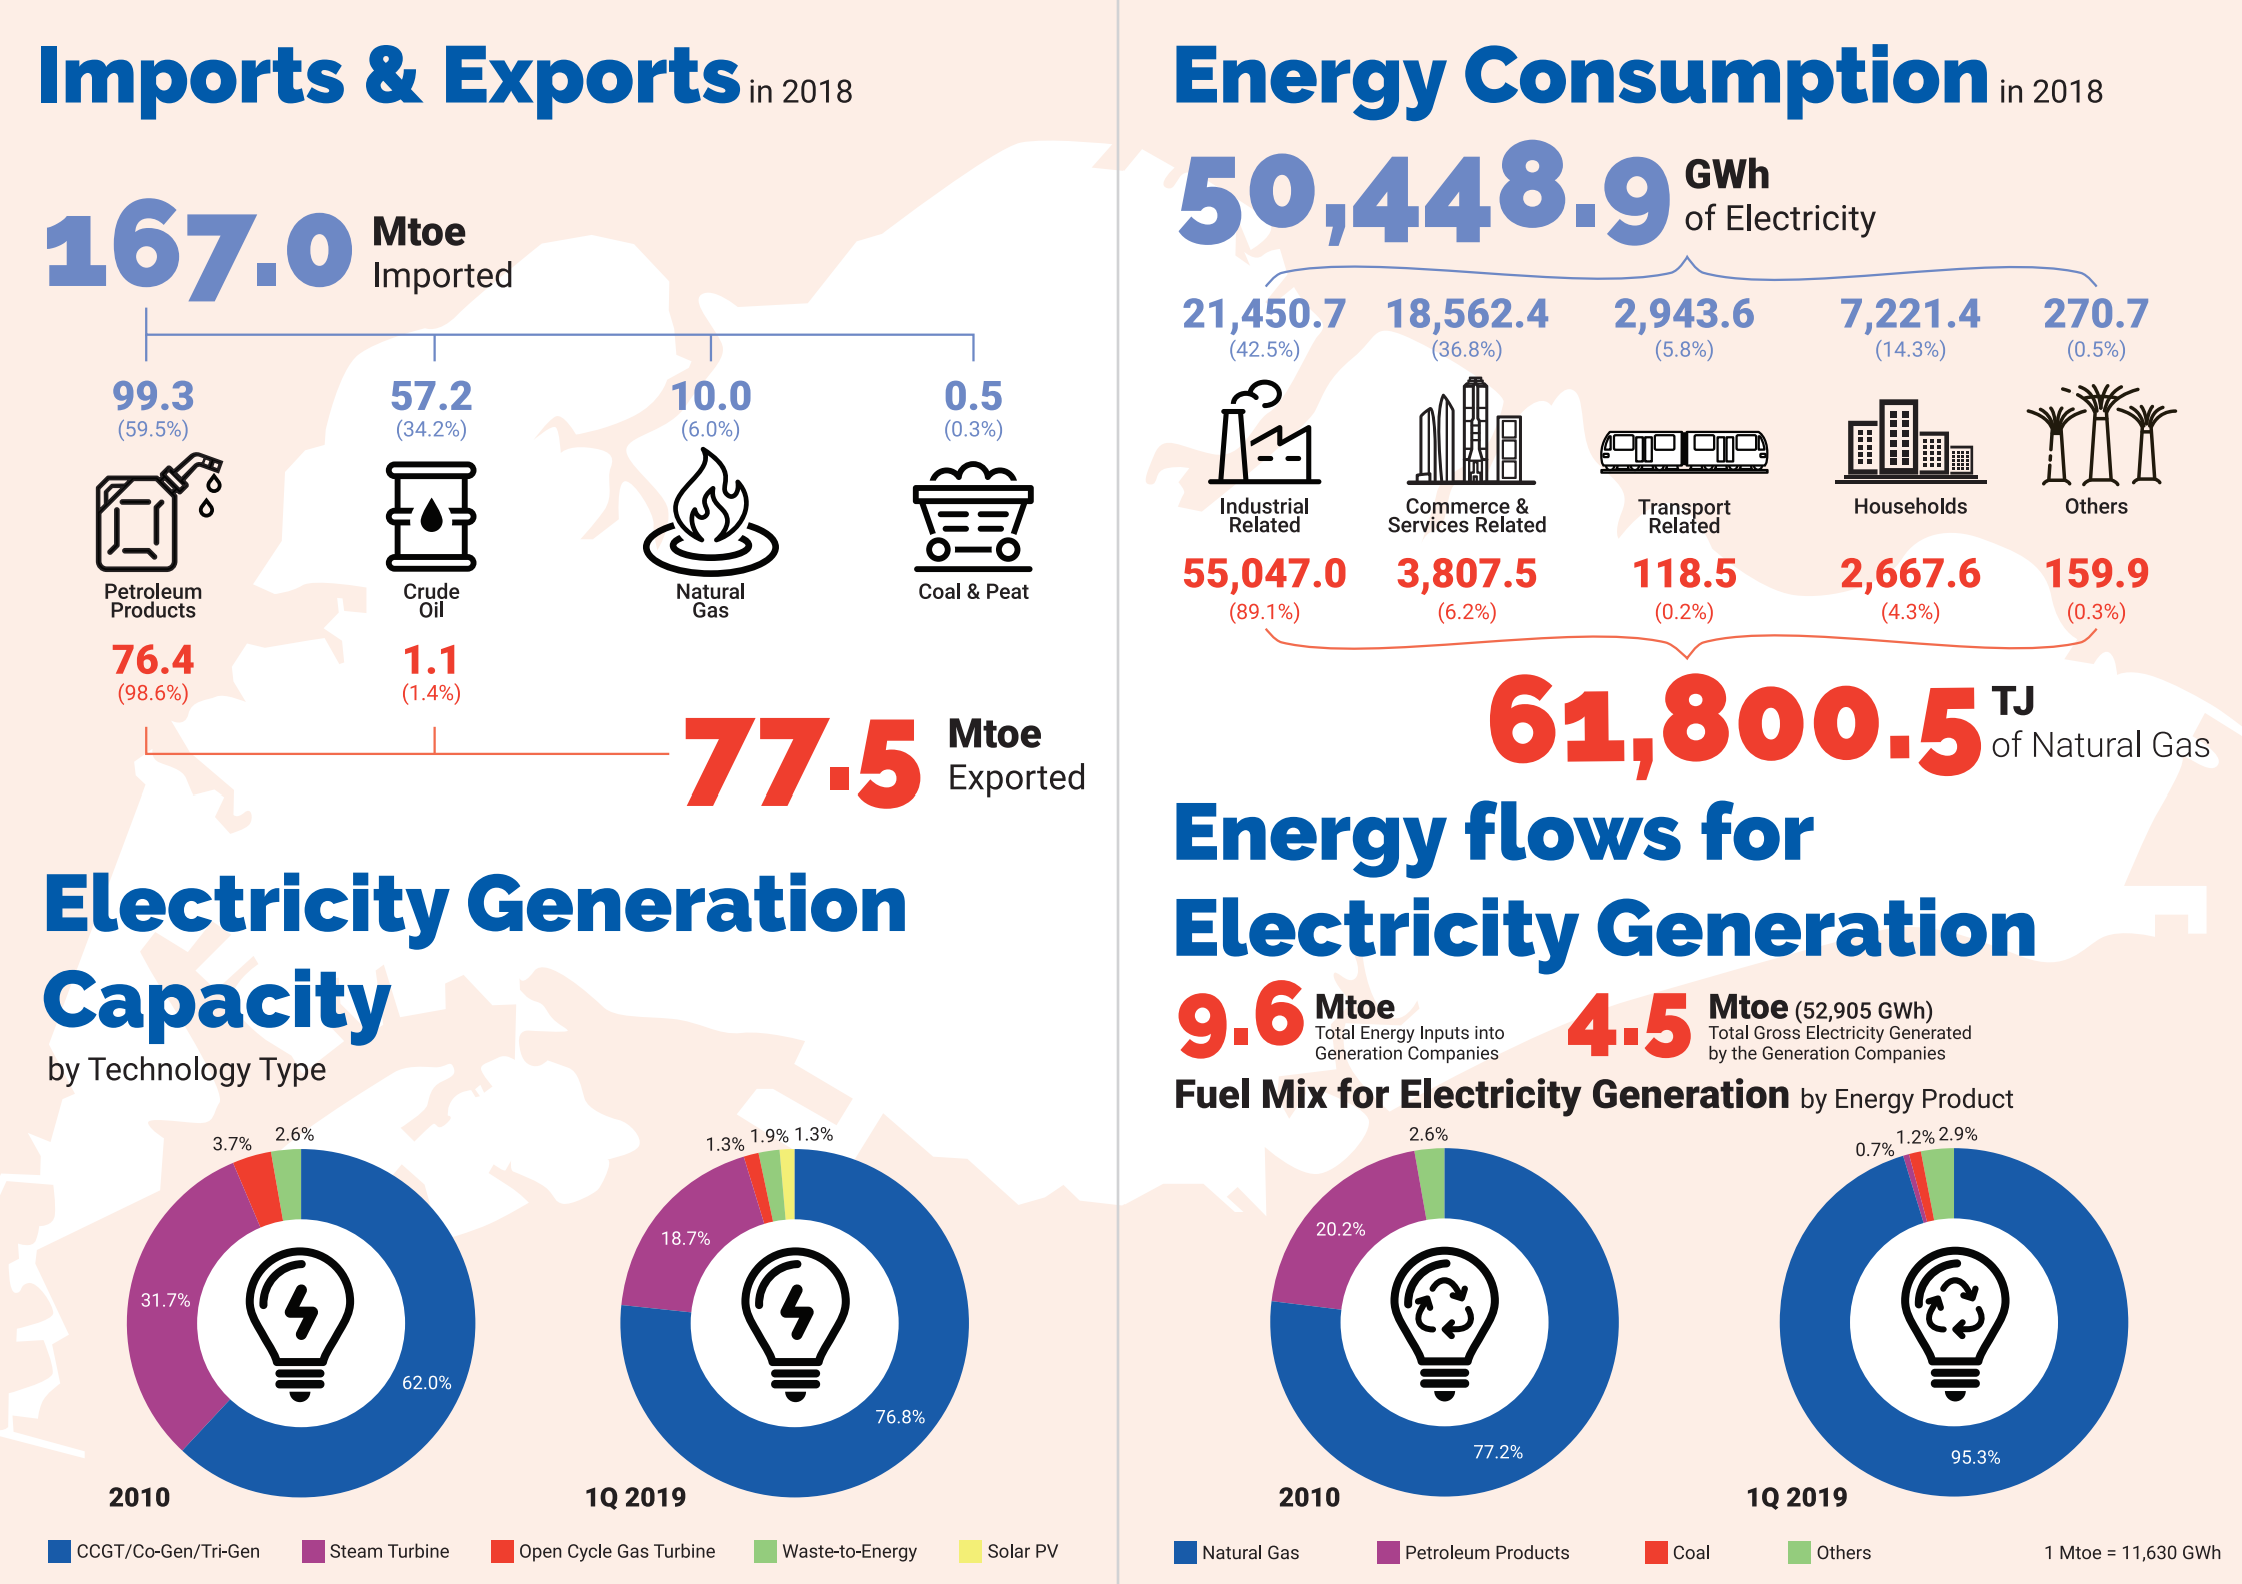
Singapore

|
Egypt

|
|
Energy
|
|
75% Of electricity is Natural Gas. |
|
Water
|
|
99% of all surface water is part of the Nile. |
|
Food
|
|
|
|
What factors are causing resource insecurity/security?
|
|
- Very high dependency on Nile water resources with growing vulnerability to changes in water use of upstream countries |
|
What are some of the Nexus connections specific to that country?
|
|
86% of water is for agriculture |
|
What is being / could be done to increase resource security?
|
Eg: Floating solar development
|
|
Singapore Infographic
Global trends in consumption


Jan 6 & 7
How does the production of drinkable water affect the production of energy and food?
The production of drinkable water is usualy done using a dam. This divert the water in the river reducing the water flow and ristricting migratory freshwater fish. This will diminish the avalable freshwater fish supply therefore reducing the production of food. Also due to the divertion of water for drinkable water produciton, there would be less water flow making any downstream hydroelectric dams less effecient and therefore reducing the
Resource recap using Singapore as an example:
-
Why is Singapore the world’s greatest ecological debtor?
- It has a virtually no ecological biocapacity per person (a very low area that is uninhabited)
- It has a very large ecological footprint (large population density)
-
Why is Singapore a world leader in developing Water Security issues when it has abundant annual rainfall and a very small population?
- Most rainfall is sent straight into the ocean through residential wastewater systems
- Singapore is leading the way in building new water supply infrastructures like new dams and better management
-
Give an example of how Singapore’s Water consumption/strategy can be viewed through a NEXUS lens.
- Singapore's water situation means that it can't grow its own food and has to rely heavily on other nations for its food supply.
-
RESOURCE 2: FOOD
An overview of global patterns and trends in the availability and consumption of:
land/food, including changing diets in middle-income countries
What patterns and trends (name indicators) might we observe - use the image below to kickstart...

Each pair present one good image (Pattern or Trend or both) of a suitable indicator (inc composite indicators).
Nutritional Transition
Info - slide 32 (our general slide show for this section, already used for water)
Data Q practice slide 34:
Land Use Transition?
Slide 38 - Make links to Water and Population Dynamics to help explain changes.
Food Security: FAD vs FED.
Slides 42-44. Note concepts.
Dec 11
Water continued using notes from general notes below and 
Video + worksheet (make a copy)
IB Geopods exercises - Briefly plus Task 5 in detail.
Note terms Embedded, Green Blue Grey. Water
Essay practice - water and sustainability
Water Security Case Study - Singapore.
Dec 10
An overview of global patterns and trends in the availability and consumption of:
● water, including embedded water in food and manufactured goods
Water - from general notes

DEc 9
Rise of global Middle class progress review and sdg 1
Food Energy Water Nexus.

Dec 4
P5
-
Ensure you have notes on how we are able to be in global deficit / overshoot
-
Ensure you can list 5 reasons why footprints are larger in HIC - use the COMPONENTS of the footprint to frame your notes.
-
Ensure you know why the trend is growing globally. Clue
-
Find the countries that are in the Sustainable Development quadrant or v close. What might they be doing right? Guess Check this page
-
Get some detail on two contrasting countries -how about the 2 you studied for Pop dynamics?


View count: 5084