Demand
Ceteris Paribus: Keeping all other variables the same when the independent variable changes.
Demand: The quantity of a good or service that consumers are willing to pay for at a given price. (Quantity demanded)
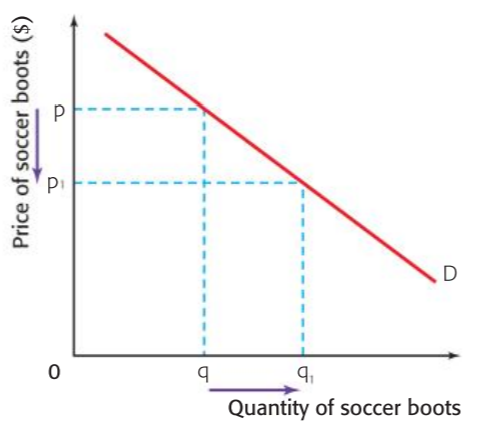
Law of demand
As the price of a product falls the quantity of that product increases. Ceteris Paribus.
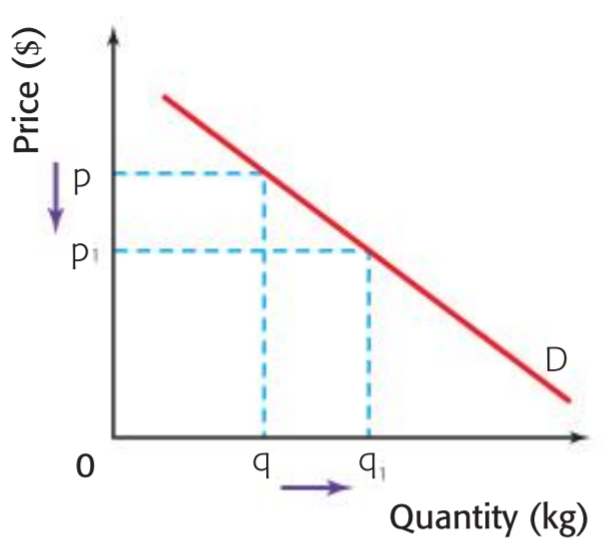
Note: In reality the curve is convex but for simplicity sakes we draw it with a straight line.
Change in demand vs change in quantity of demand
Change in demand
This is when the demand curve actually shifts left or right.

Change in quantity of demand
This is a movement along the demand curve, caused by a change in price.
Non-price determinants of demand
The non-price determinants of demands are the factors which cause demand to shift left or right.
| Non-Price determinant |
Reason |
Example |
| Income changes |
The more money people have the more they consume. Normal and luxury goods see increased demand with higher income while inferior goods see lower demand. |
The more money you have the higher quantity of steak you may purchase. |
| Price of related goods |
If the price of a competing good goes up, consumers may stop buying it and buy other goods. |
If coke increases in price pepsi will see higher demand |
| Tastes and preferences |
If a certain type of good becomes trendy consumers will buy more off it. |
Ripped jeans came into fashion so demand increases. |
| Demographic changes |
Certain groups of people demand different products, so if the demographic changes there may become more or less demand for products. |
if more pale skinned people immigrate to Africa, demand for sunscreen increases. |
| Future expectations |
Consumers change their buying habits based on their expectations of whether their will be a shortage or surplus. If consumers think there will be a shortage they will stockpile, if they think there will be a surplus they will wait till then to buy goods. |
Before a hurricane people stockpile on supplies
https://youtu.be/IoTRNZS2OtQ?t=60
|
| Seasonal changes |
During different seasons different products are wanted |
Icecream and suncream are products demanded more during the summer. |
Supply
Supply: The quantity of a certain good which firms are willing and able to offer at a certain price.
Individual supply vs market supply
individual supply: this is the amount of a product that heir firm supplies in a certain timeframe.
market supply: this is the supply of the product for the entire market.
Supply curve
As the price increases producers can supply more of a product. This is the opposite of demand. Therefore the supply curve looks like a demand curve reflected in the y-axis.

Non-price determinants of supply
The non-price determinants of supply are the factors which cause supply to shift left or right.
| Non-price determinant |
Reason |
Example |
| Price of related goods |
If other goods go up in price, producers will produce more of that good as it pays better and less of other goods. |
If wheat goes up in price farmers may produce more of it and less of soy. |
| Costs of production |
If it costs more to produce something suppliers can't produce as much |
Minimum wage causes costs of production. |
| Technological changes |
The better the technology the more supply can be produced |
Robotic arms allowed cars to be made faster and for less money. |
| Future expectations |
If producers think a product will be sold for higher prices in the future they may withhold from the market until then. |
Chocolate makers may wait until easter to sell their product. |
| Government intervention |
- Regulations can be imposed lowering the price of goods these will reduce supply.
- Taxes can be imposed are considered costs of production and lower supply
- Subsidies given can increase how much can be supplied
|
Government gives subsidies to farmers to be able to produce more rice. |
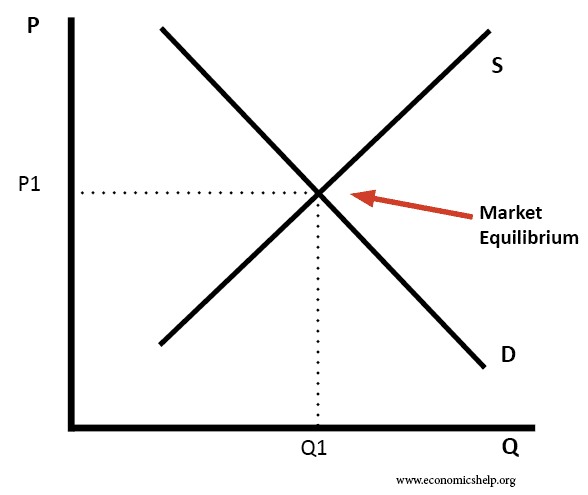
Market Equilibrium
Demand and supply curves together
Demand and supply curves are not normally drawn separately. Normally they are drawn on the same graph.
It is important that since it is both supply and demand, the x-axis should be labeled "Quantity of units" or just "Q". The y-axis should be "Price ($)"

Equilibrium of the market
At any price there is a quantity demanded by consumers and a quantity able to be supplied by producers.
The most desirable position to be add is one where the quantity of supply an demand match, so there is neither a shortage of surplus. This is called the market equilibrium
Market equilibrium: The price in a market at which the quantity demanded and the quantity supplied of a good are equal to one another. It occurs at the intersection of the demand and supply curve.
Changes in market equilibrium
if supply or demand shifts, the market is in disequilibrium and so the price will shift to return to the market equilibrium.
E.g if the demand curve shifts left at every price less product is demanded. At the original price there is now a surplus and the producers can't sell all of their product. Therefore they will lower their prices to meet the level of demand.

Market efficiency
Efficiency: Firms have maximum efficiency when the are making the best possible use of resources
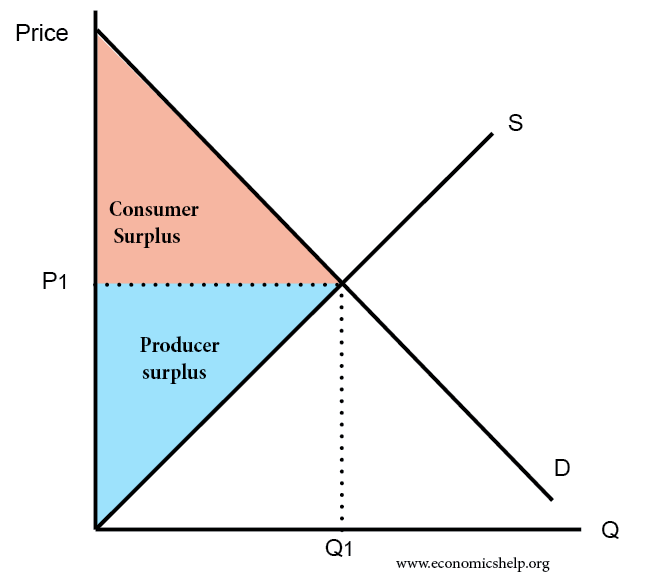
Consumer and producer surplus
Consumers and producers have different levels of prices which they are willing and able to produce at. To draw them on a graph draw a horizontal line out from the market equilibrium and then divide the left triangle into two. The top is the consumer surplus, the bottom is the producer surplus.
Consumer surplus: This is where consumers may have been willing to pay more for a product but don't have to, because the price is lower. This amount of consumers who pay less than they were willing to are the surplus. This benefits them because they pay less. For example some consumers may be willing to pay 10$ for a loaf of bread while others can only afford to pay 1$. We want to maximize consumer surplus.
Producer surplus: This is where producers may have been willing to sell the product for less but don't have to, as the market price is higher. The value of the producer surplus is the quantity of products which could've been sold at a lower price but were not. We try to maximize producer surplus.
Allocative and productive efficiency
Allocative efficiency: This is the optimal combination of goods are produced from society's point of view. At this point nothing can be changed with out making another stakeholder worse off. This occurs when consumer surplus and producer surplus are at the maximum aka equal. Whenever the demand and supply curve have the same elasticity and at market equilibrium there is allocative efficiency. it is also known as pareto optimality. MB = MC
productive efficiency: Producers are producing goods with the lowest amount of resources and thus lowest costs. This means they are producing the maximum quantity of goods at the price.
View count: 11493