The nuclear model of the atom
Protons, neutrons and electrons have charges and masses. The masses and charges are too small to be much use in chemistry. For example, the mass of a single electron is 9.109 × 10⁻³¹ kilograms. We, therefore, use relative values for the masses and charges of the subatomic particles, shown below.
The exact masses (in kg) of a proton, neutron and electron can be found in section 4 of the Chemistry data booklet.
| Subatomic particle |
Relative charge |
Relative mass |
Location |
| Proton |
1+ |
1 |
nucleus |
| Neutron |
0 |
1 |
nucleus |
| Electron |
1− |
1/2000 |
surrounding the nucleus |
Mass and Atomic Numbers
- The atomic (or proton) number = the number of protons in the nucleus of the atom.
- The mass (or nucleon) number = number of protons + neutrons.
- The number of neutrons = mass number − atomic number.

An easy way to remember the order of the nuclear symbol undefined is “A to Z”.
Isotopes
Isotopes are atoms of the same element that have the same number of protons in the nucleus but a different number of neutrons. In other words, isotopes of the same element have the same atomic number but a different mass number.
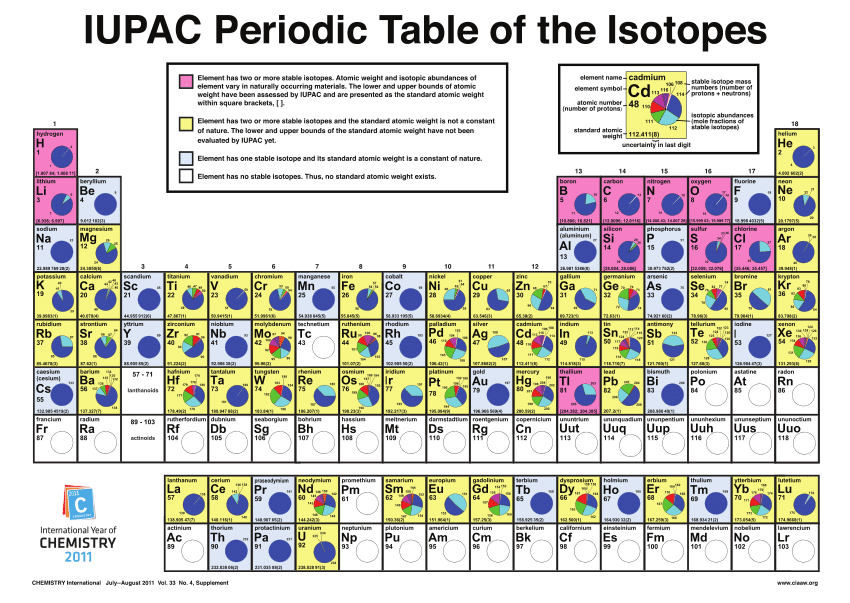
The atomic masses and proportions of the naturally occurring isotopes of several elements.
Isotopes have slightly different physical properties, like small differences in density, which enables isotopes of the same element to be separated. This is of particular importance for the enrichment of nuclear fuel, a process that is covered in more detail later.
Beware that isotopes are often written with just their mass number A. For example, chlorine with a mass of 37, may be written as chlorine-37, 37Cl, or Cl-37.
Relative atomic mass
Mass Spectrometer
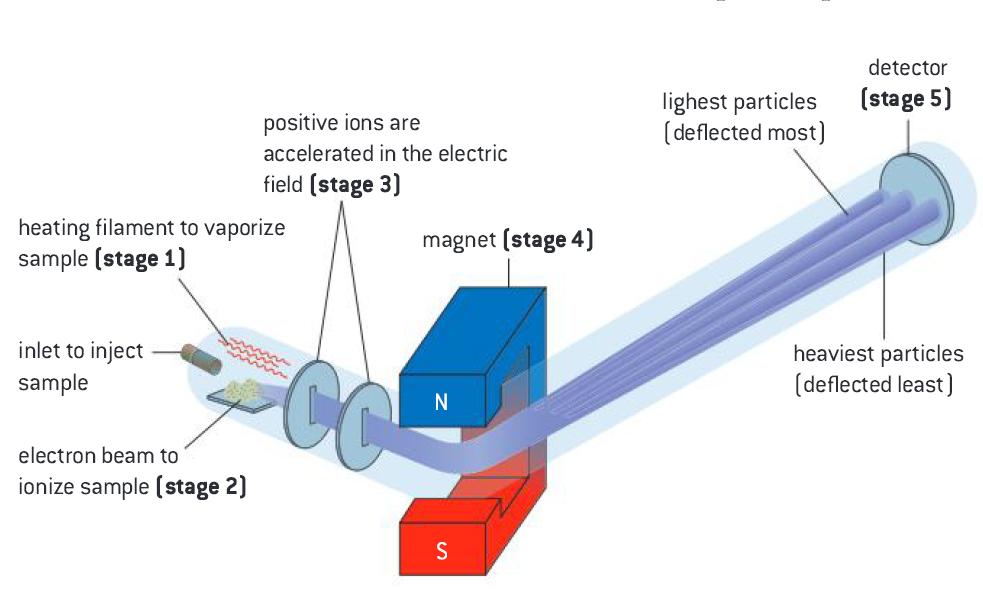
The mass spectrometer is an instrument used to determine the relative atomic mass of an element. It can also show its isotopic composition.
- Vaporization: The sample is injected, heated and vaporized, producing gaseous atoms/molecules
- Ionization: The gaseous atoms are bombarded by high energy electrons, generating positively charged atoms/molecules
- Acceleration: The positive ions are attracted to negatively charged plates and accelerated in the electric field.
- Deflection: The positive ions are deflected by a magnetic field perpendicular to their path. The degree of deflection depends on the mass-to-charge ratio (the m/z ratio). The species with the smallest mass, m, and the highest charge, z, will be deflected the most.
- Detection: The ions hit the counter and an electrical signal is generated. The height of each peak indicates the relative abundance of the respective isotope.
Mass spectrum
A mass spectrometer produces a mass spectrum. This is a diagram which has a relative abundance on the y-axis and mass/charge ratio on the x-axis.
Most often the charge is +1, so the mass/charge ratio represents the mass number of that isotope, but for other charges, it does not. For a charge of +2 for example, it will represent half the mass number.
Note: m/z = mass to charge
How to calculate the relative atomic mass
Multiply the relative percentage abundance of each isotope by the mass number and sum the answer. If you are given a mass spectrum you can assume the mass/charge is the mass.
Atomic orbitals
Main energy levels
The main energy levels start at n=1, and move out towards n=∞
As the energy levels approach infinity they become closer and closer.
Sub energy levels
The main energy levels are actually split into sub-levels. Each sublevel has a letter assigned to it: s, p, d or f.
The sub levels themselves are composed of atomic orbitals, each containing 2 electrons. orbitals are areas with a higher electron probability.
These orbitals have different shapes and orientations for each sub-level.
Orbital shapes
You need to remember the s and p orbital shapes (not d & f shapes).
S orbital: This is a sphere
P orbital: this is a dumbell shape. There are an x,y and z version, which are all aligned on a different axis.

Electrons in sub levels
|
Main energy level
|
Sub-level
|
Number of electrons in sub-level
|
Maximum number of electrons in the main energy level
|
|
n=1
|
s
|
2
|
2
|
|
n=2
|
s
p
|
2
6
|
8
|
|
n=3
|
s
p
d
|
2
6
10
|
18
|
|
n=4
|
s
p
d
f
|
2
6
10
14
|
32
|
Note: the number of electrons in electrons in each sub-level go up by 4 each time. The number of orbitals in each sub-level increase by two each time.
Electron configurations
Order of filling
The electron shells fill up in order of the lowest energy level.
The order can be represented by writing out each main energy level one below each other to form a triangle, and following a path along the diagonals. It's easier to understand looking at the diagram.


You'll notice 4s fills up before, 3d and this is important.
Order of removal
Whereas when filling the electron orbitals it goes in order of energy levels, when removing the electrons it goes in order of orbitals.
This means you remove 4s first and then 3d not the other way around. This is a common mistake student smake.
How to write electron configurations
To write out the electron configuration write the main energy shell first then the sub-shell letter then in superscript the number of electrons in the subshell.

Full configuration
Write out the whole configuration, and stop when all the electrons in the element are accounted for.
Br: 1s2 2s2 2p6 3s2 3p6 4s2 3d10 4p5
Condensed configuration
Replace a chunk of the configuration with that of a noble gas, as they are a full main shell. This saves a lot of time.
Br: [Ar] 4s2 3d104p5
Some Exceptions: Chromium and Copper
Two of the first 36 elements have electron configurations that differ from what you may predict. These two elements are Cr (Z= 24) and Cu (Z= 29):
- Cr 1s22s22p63s23p64s13d5
- Cu 1s22s22p63s23p64s13d10
In these two elements, electrons go into the 3d orbitals before completely filling the 4s orbital. Chromium has a half-filled 3d sublevel of 5 electrons and copper has a completely filled 3d sublevel of 10 electrons.
Line spectra
Electromagnetic spectrum
The light spectrum is determined by wavelength.
The order from shortest wavelength to longest wavelength is:
- gamma rays
- X-rays
- Ultraviolet
- Visible light
- Infrared
- Microwaves
- Radiowaves

As frequency increases, energy increases, but wavelength decreases.
Emission spectrum
N=1: is the ground state
When energy is given to an electron in an energy shell it will be excited and move to a higher energy shell depending on how much energy is given to it.
When the electron relaxes and falls back down to its initial energy level it releases its potential energy in the form of a photon of light. The photon has the same energy as that which the electron absorbed at the start.

The hydrogen emission spectrum
The different energy level the electron falls down to determines which type of light will be produced.
N=1: UV raidation
N=2: Visible light
N=3: Infra radiaition
(Make sure you know the above states)

Loose ends
Weird past question on UV-B Radiation
In the past, Ib has asked some weird questions on UV-B radiation so be sure you can answer them.
The thinning of the ozone layer increases the amount of UV-B radiation that reaches the Earth’s surface.
|
Type of Radiation
|
Wavelength/nm
|
|
UV-A
|
320–380
|
|
UV-B
|
290–320
|
Based on the information in the table above explain why UV-B rays are more dangerous than UV-A:
- UV-B radiation has a shorter wavelength;
- Hence, has higher energy;
- Increases risk of damage to skin cells / OWTTE / causes cancer;
(3 marks)
Uses of radioactive isotopes
TODO
Editors- joeClinton - 734 words.
- CD_FER - 559 words.
View count: 15699